Memoir - Marvin L. Hackert
Memoir | Publications | Curriculum Vitae | Videos | Slides | Articles | Obituary
50+ Years of Crystallography
2020
Statement: When I was asked to write a “Living History” article for ACA RefleXions and this longer version for the AIP Archives and ACA History Portal, it caused me to not only reflect back on over 50 years of X-ray crystallography and think about the many changes and advances that have happened to our science over that half century, but also to reflect and appreciate the many people along the way that played an important role in my journey and express my gratitude. However, before I share those historical insights on the changes I have seen and experienced in our field, I want to spend some time on my early years to put my journey into perspective.
Early Years: I have many fond memories of growing up on a farm south of the Dutch community of Pella, Iowa. As did my parents, I attended a one-room country school house (Pleasant Grove Community School) with one teacher teaching all subjects to all kids in kindergarten through eighth grade. We did not pay much attention to grades, but I know I graduated either valedictorian or salutatorian of my class since there were only two of us in my 8th grade class. Unlike my parents, I had the opportunity to go on to high school, then college, and on to graduate school. In high school I loved math and science, played football and ran track, and was active in the local FFA (Future Farmers of America) chapter. I learned a lot of valuable skills in Vocational Agriculture – not only handyman skills like carpentry, welding, etc., but also public speaking as our freshman FFA Creed speaker and Robert’s Rules of Order as parliamentarian of our high school FFA team.
However, pursuing both science and agriculture got to be a bit awkward by my junior year in high school since the chemistry class overlapped with my vocational agriculture class. My teachers worked it out, allowing me to attend chemistry two of the five days and the Voc Ag class on the other three days. I learned years later that my classmates liked the fact that they knew that the chemistry pop-quizzes would only happen on Tuesdays or Thursdays!
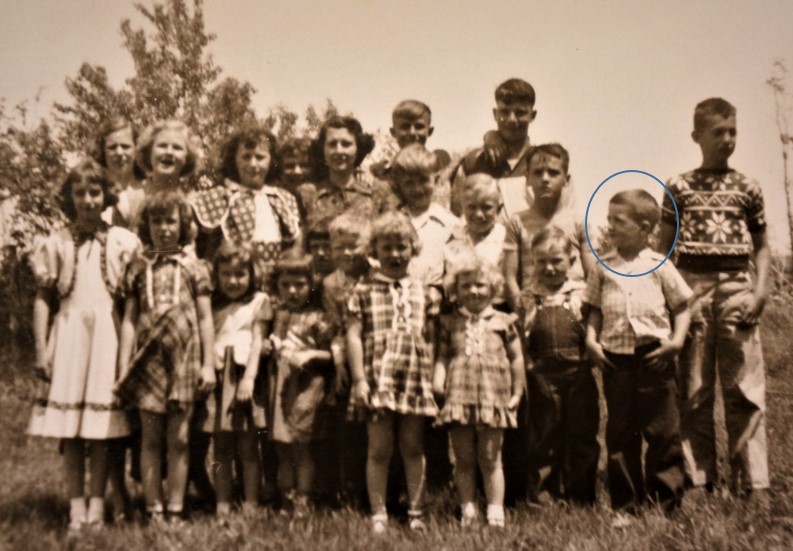
Pleasant Grove Community Country School (K – 8 grades).
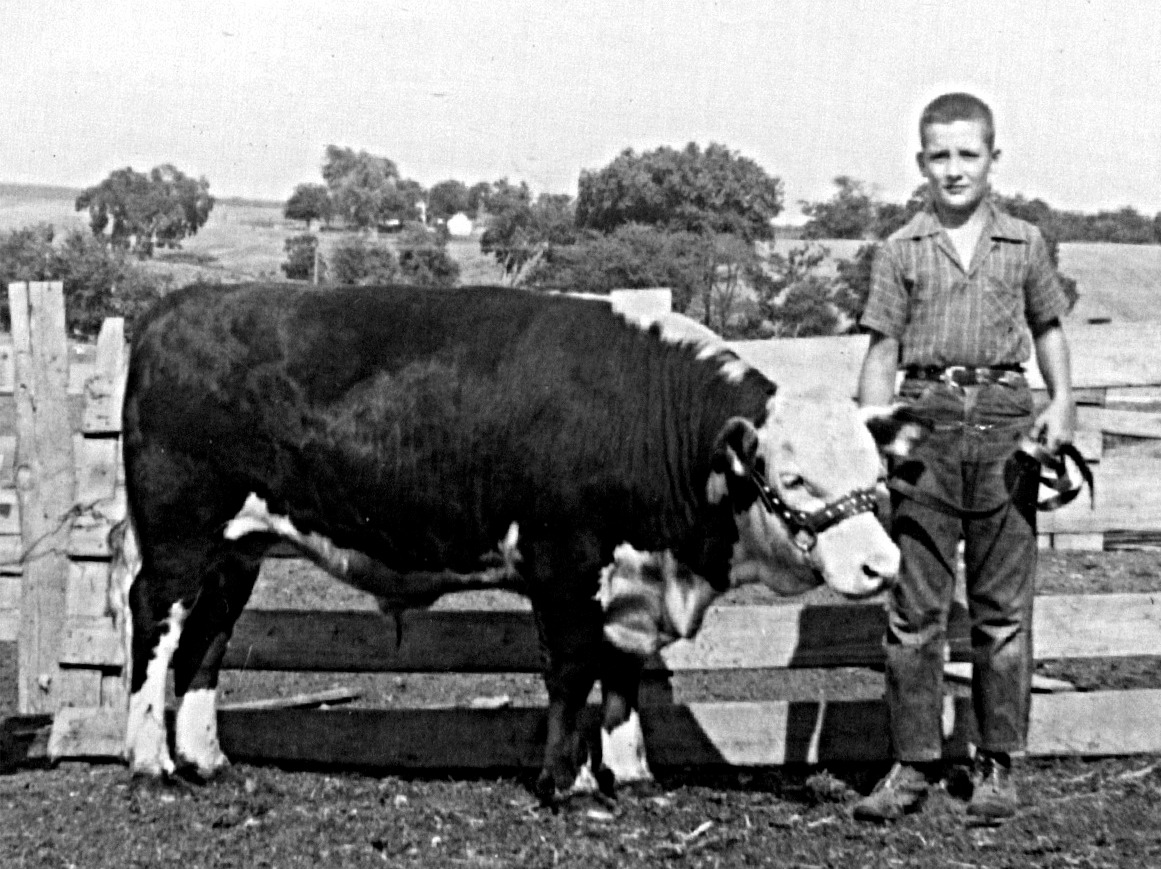
Preparing to show calf at County Fair.
I never even thought about going to college until the spring of my senior year, when a counselor (Miss Gosselink) told me that she was pretty sure I could get a scholarship from the local liberal arts college (Central College) if I would just apply, and convinced me I should apply and consider becoming a math or science teacher. Today, kids are under a lot of pressure from their parents to earn high grades and get accepted into the right college. My situation was quite the opposite. When I mentioned to my parents that I was being encouraged to apply for college, my Dad’s response was – “Why on earth would you want to do that for?” Miss Gosselink was just one of several caring teachers who made the extra effort, nudging me and guiding me to opportunities and possibilities that I had not considered before. Another teacher who had a major influence on my life was Mr. Groendyke at Pella High School who showed me that chemistry and physics could be fun. He had taught math, chemistry and physics and mentioned to me that he would be ready to retire about the time I would graduate from Central – another nudge. The final nudge to get me to apply to college was my good friend and another farm boy – Roger W. He wanted to play more football and suggested that we go to Central in the fall, play football and then drop out. That never happened – the scholarship I received did not begin cover all the costs, so I ended up working multiple jobs. Roger played football for four years, then went on to earn a PhD in biology.
My favorite memories of Central involve people – doing things with friends and classmates. In those days the freshman class wore “beanies”, and we had required 8:00 chapel. It seemed I spent most of my time on the 3rd floor of Central Hall (Chemistry labs), or the old library, or the Student Union where I worked the night shift that also provided me the opportunity to improve my skills at pool and table tennis. Knowing Robert’s Rules came in handy when I was elected secretary and later president of our local Chemistry Club. I also served on Student Council and was class president during my junior year. I was fortunate to have had an enthusiastic and creative group of classmates that designed and built the winning homecoming float (with sound and animation) for the parade.
I came to Central to be a math or physics major with the idea of teaching high school math and science after graduation. However, chemistry professor Dr. Dave Crichton was my assigned advisor when I arrived on campus, and he quickly convinced me of the error of my ways – chemistry is the central science he stated as if it was a well-known fact. He immediately got me enrolled in freshman chemistry and even helped me obtain a part-time job working in the chemistry storeroom, and later as a “TA” for the freshman chemistry labs. We had our share of “failed” experiments, acid spills, fires, etc., that kept things interesting and helped our small cohort of chemistry majors develop a sense of kinship as classmates and with our teachers (Drs. Dave Crichton, Harold Kolenbrander, and Art Bosch). We started out with about 40 freshman chemistry students, but after four years we had just three chemistry majors that graduated. I earned a B.A. with honors in chemistry, doing enzyme kinetics for an undergraduate research project with a young biochemist named Dr. Harold Kolenbrander. I believe I was the first Central College graduate who wrote and submitted a research thesis to graduate with honors from Central.
Being a Graduate Student in the '60s: Although I enjoyed my classes and research, at that time I was still thinking of teaching at the high school level. However, at Central the culture was if you were a chemistry major, you were strongly encouraged (expected) to attend either graduate school or medical school. My chemistry teachers encouraged me to pursue graduate work, noting that colleges like Central were growing and would be adding additional faculty in the coming years. I applied to and was accepted to several schools, but decided to attend Iowa State University where I had spent a summer working with Dr. Frank Spedding, Director of Ames Lab at the time. Dr. Spedding was famous for his work with rare earth elements and the process for extracting uranium which contributed to the Manhattan Project to build the first atomic bombs used in WW II. In the mid-1960s Iowa State with its Ames Lab had one of the largest chemistry programs in the country. There were 66 new chemistry graduate students from all over the country in the incoming class that fall, including a couple of graduates from UC Berkeley. Every incoming student was required to take a battery of four comprehensive placement exams to determine whether you were really ready for graduate course work in the basic areas of organic, physical, inorganic and analytical chemistry. Two of the three Central chemistry graduates were in that group of 66. We were both intimidated by all the advanced topics classes that many of the other students had coming from the large schools. However, out of 66 students, only 8 students passed all four exams – two of those were Central grads (Doug J. and I) and two were from Berkeley – not a bad comparison group for Central College grads to be in.
You hear a lot about the need for competitive graduate student funding these days. I worked several odd jobs to fund my undergraduate education that paid minimum wage or slightly higher – around $1.00 to $1.25 per hour. A 44-hour work week was common back then, so I and my friends were earning about $50 per week or $220 per month during the summers when we worked full-time. In going to graduate school, I was awarded a NDEA Fellowship with a stipend of $2000 for 9 months, but I was married at that time and it came with a dependent allowance of $500 per 9 months, and increased by $200 during the 2nd and 3rd years. Thus, as a graduate student I was making just under $300 per month – more than I would have been earning working full-time at minimum wage! So, how do today’s graduate stipends compare to the stipends in the 1960s. In the STEM fields at The University of Texas at Austin today, competitive, half-time TA or GRA offers are around $31,000 per 12 months and NSF stipends are $34,000 per 12 months. Our best graduate fellowship is a 5-year package that comes with a stipend of $40,000 per year and includes payment of all tuition, covers basic medical insurance and provides a small yearly research stipend. Texas has a legal minimum wage of $7.25 per hour – the minimum mandated by the federal government. This equates to just over $15,000/yr working 40 hour weeks for 52 weeks a year. Thus, half-time STEM graduate students currently are paid about twice what full-time minimum wage workers are earning. There are a lot of cities that have adopted a minimum wage for public employees of $15/hr. Even at that higher rate our STEM graduate students are earning just slightly more than full-time public employees – surprisingly similar to what it was in the mid-1960s. Of course the cost-of-living in Austin, Tx is a lot higher than that for living in Ames, Iowa, and many of today’s graduate students outside the STEM fields do not receive such high financial offers and so are struggling hard to make ends meet.
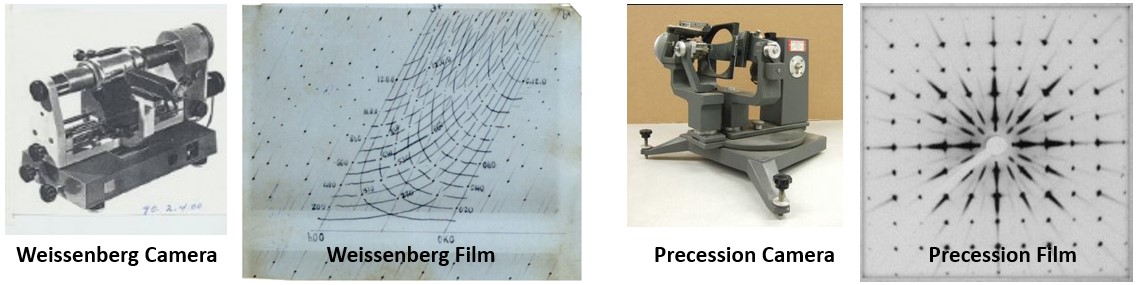
Becoming a Crystallographer: At Iowa State I did a rotation in crystallography in the laboratory of Prof. Robert Jacobson and immediately fell in love with crystallography and the people. The X-ray lab was well equipped so we learned how to prepare samples and collect data with powder, Weissenberg camera & Buerger Precession cameras and a quarter-circle diffractometer. I had found some pretty, gold-colored, cubic crystalline material in the creek on our Iowa farm. I did my one and only powder diffraction experiment confirming that it was indeed iron pyrite (fool’s gold). I admired the mechanics and operation of both the Weissenberg camera and Buerger Precession camera, but confess that indexing the “lunes” captured on a zero level Weissenberg photograph to determine space group and obtain lattice constants was a challenge. Everyone in the lab much preferred to screen and characterize their crystals using the precession camera. This was especially true when we obtained a Polaroid film cassette to use with the precession camera that eliminated spending large amounts of time in the dark room when aligning your crystal.
Bob Jacobson taught a course in X-ray crystallography that covered all the basics including point groups, space groups, theory of diffraction, data collection and data reduction, phase determination and refinement. My first crystal structure was Ag2CrO4. One would have thought the structure of something that common would have been known by then, but it is a very insoluble material and difficult to crystallize. I grew the crystals inside a gel-filled U-tube placing a solution of AgNO3 on one side and K2CrO4 on the other side and letting the ions slowly diffuse within the gel, crystals formed at the interface where the ions met. Once I had the crystals, the data was collected by hand, one reflection at a time on a quarter circle GE diffractometer. After the crystal was mounted, one would find and manually center a small number of high 2-theta reflections that would be used to calculate more accurate lattice constants and the orientation matrix for the crystal. This was done on the campus main-frame IBM computer. The program would then predict the location of each reflection, punch a computer card for each reflection with the HKLs and angle settings. These angles were each set by hand on the diffractometer. We typically collected a 10- to 20-sec background reading on one side of the reflection, scanned across the peak, and took another background reading on the other side, taking about 2 to 3 minutes in total to measure each reflection. The numbers were written on the computer card so they could later be key-punched onto the card for processing to estimate the intensity of each reflection. When your turn came to use the diffractometer, it was a 24-hour per day run until you had your data set. Thus it was important to have good friends who would spell you when you needed to take a break. While that sounds impossibly slow and tedious by today’s standards, the diffractometer was a big improvement over visually estimating intensities from film. Also, there were only 325 Bragg reflections used to determine the Ag2CrO4 structure!
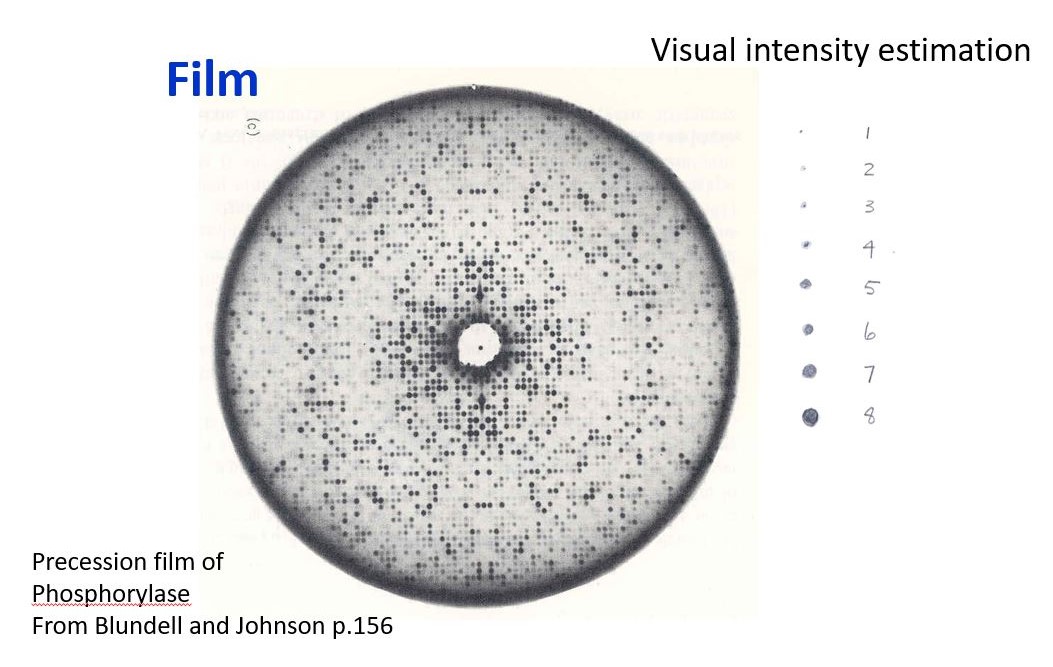
Early detectors: Film - visual estimate of intensity.
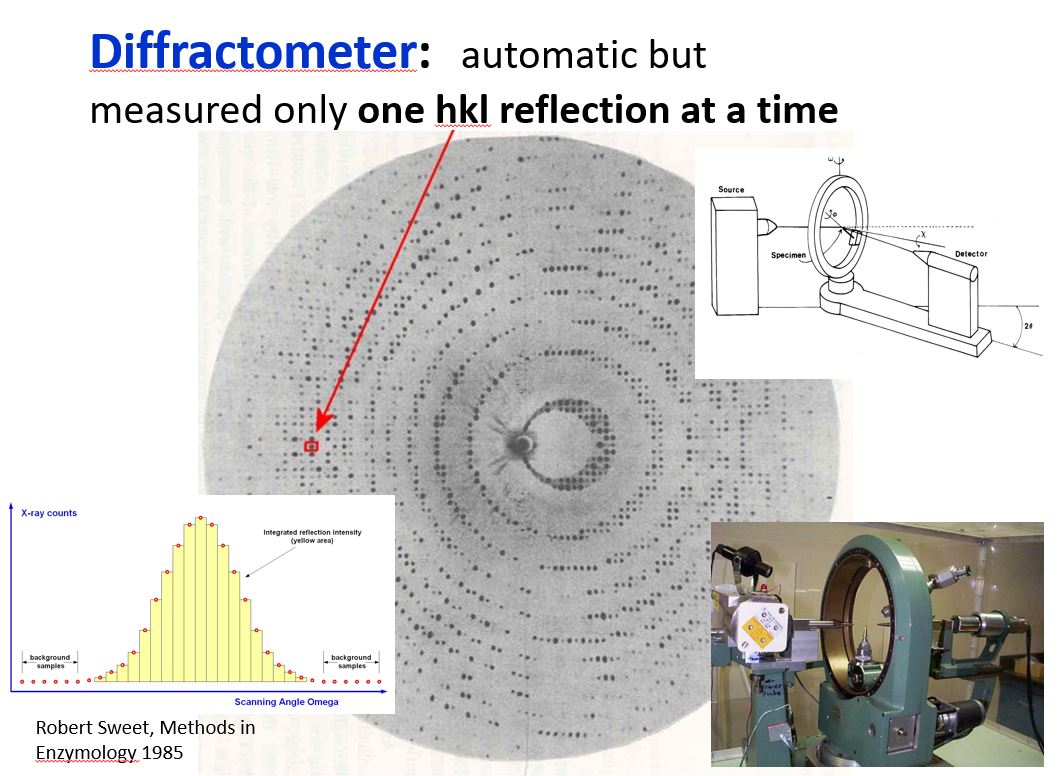
Diffractometer – scan across peak.
A few words about the culture of being a graduate student doing crystallography in the mid to late 1960’s seem appropriate. Since the campus had one IBM main-frame computer that had to handle both administrative as well as research computing needs, you tended to be most productive in terms of computer turn-around time by submitting jobs very early or very late rather than get caught up in all the administrative and students jobs running between 8 and 5. Thus one would often work very late, come in early to get another run turned in before 8, but then not expect turn around to happen quickly during the day. So the days were for working in the wet lab, growing crystals, teaching, or collecting data. This often led to some spare time waiting for computer output, and graduate students filled that time in a variety of ways. We were in the basement of an old chemistry building. It was not uncommon to see students playing keep-away with a Frisbee in the hallways late at night. During the day, some would take advantage of a public golf course on the edge of campus whose first tee was only a few short blocks away from the lab. We also shared the basement with a number of mice that would be given names like pets. While today’s graduate students may find this strange in today’s more regulated world, it led to some interesting memories and long lasting friendships with colleagues. Two of those lab mates that I have continued to see at ACA meetings over the past 50 years are Camden Hubbard and Jack Johnson.
I did a number of other small molecule structures working in conjunction with inorganic and organic synthetic chemists. Laboratory computers were rare, but becoming more common. However, main frame software packages like ORFLS and ORTEP (Oak Ridge Structure Factor Least Squares program by William Busing & Henri Levy / Oak Ridge Thermal-Ellipsoid Plot program by Carroll Johnson) were becoming available and popular in the mid-to-late 1960’s. I especially loved working with ORTEP. Carroll Johnson who wrote ORTEP, became a hero of mine. First released in 1965, ORTEP rapidly became a favorite of crystallographers to produce illustrations of structures for conference presentations and publications. Many of my colleagues struggled using ORTEP to generate publication quality images of their structures because at that time the plotters could not account for what should be hidden lines, so you had to use “white-out” to remove lines that should have been hidden. I quickly learned to deal with this by crossing my eyes to see large ORTEP figures in stereo which made identifying lines that needed to be removed by white-out fast and easy. To my knowledge, in 1970 I was the first person to publish triplet (L / R / L) images in my dissertation so a person could see stereo images as either “wall-eyed” or “cross-eyed” stereo pairs on the same page.
ORTEP from first my Acta Cryst. paper (1970).
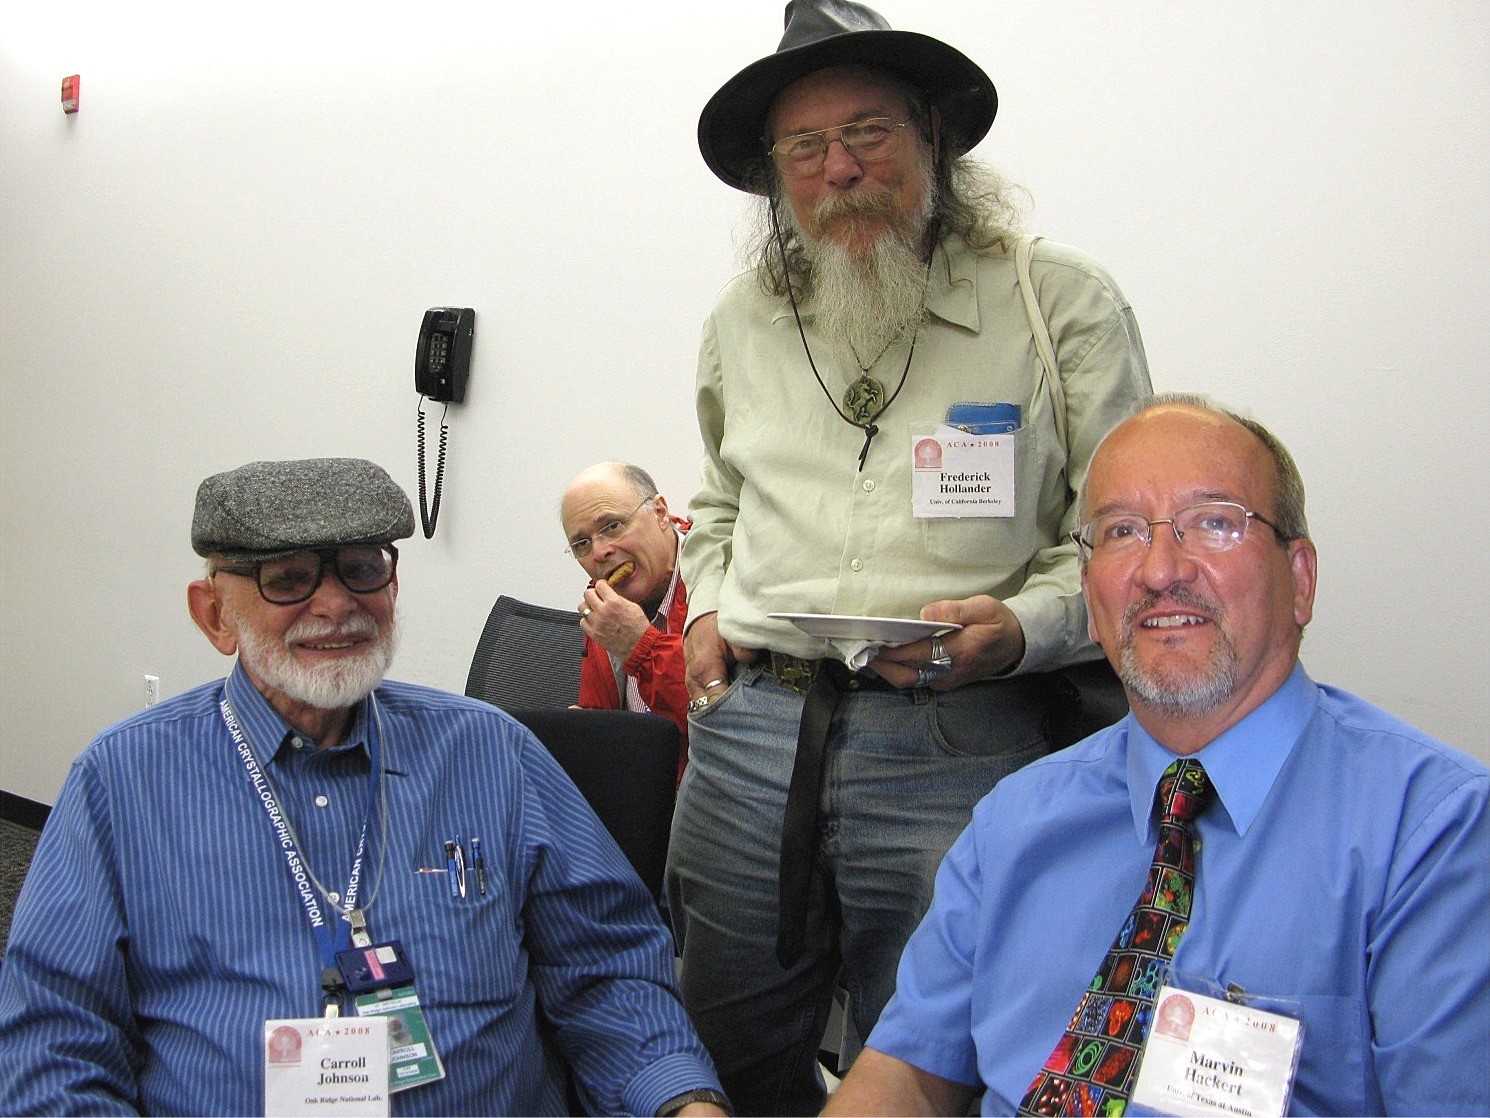
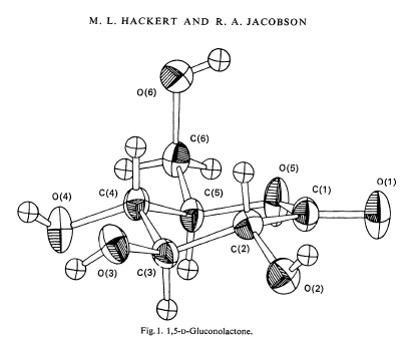
With Carroll Johnson (left), Frederick Hollander, Charlie Carter (rear) at ACA meeting in Knoxville, 2008.
Most of these structures were determined using the heavy atom methods, but I struggled with the structure of a small molecule lactone of only C, H, and O. I was fond of Patterson methods, and working with Dr. Robert Jacobson we developed a new idea we called the Discriminator Method based on successive, successful Patterson superimposition runs. This was successful in helping solve the lactone structure and I presented this work over 50 years ago in the spring of 1970 in New Orleans at my first ACA meeting. Back then there were only oral presentations at ACA meetings. The ACA met twice a year - spring and summer meetings – usually at a university location with only a couple of hundred attendees (there were very few biomacromolecular crystallographers back then). I remember fondly being on a River Paddle Boat cruise on the Mississippi during the ACA excursion and being star-stuck at meeting Carroll Johnson, Bill Busing, Walter Hamilton and others. From that first meeting over 50 years ago, our ACA conferences have continued to be my favorite meeting to attend. The ACA had officers, but no business office as I recall. Student dues were only $5/yr, but you had to be endorsed by two ACA members to join. I purchased my own personal hard-bound copy of Volume I of the International Tables for $9! That was like the Bible for crystallographers. It helped you understand the extinction conditions to determine your space group. Also, since you often had to write your own Fourier program to calculate your electron density map, the efficient way to do that was by taking advantage of the symmetry of each space group as laid out space group by space group in Vol. I of the International Tables.
It was still my intention to seek a teaching job at a liberal arts college somewhere in the mid-west after I completed my degree. However, those were the days of the war in Vietnam, campus protests, the Peace Movement, Hippies, draft resisters, Woodstock, etc. Many state legislators took a dim view of what was happening on campuses around the country; funding for new positions in higher education and jobs in general were hard to come by. Then one day a five-minute conversation totally changed the direction of my career and life. As I was completing my PhD in physical chemistry at Iowa State, my supervising professor (Dr. Robert Jacobson) walked into my office, sat down on the edge of my desk and gave me his version of a short pep talk on the merits of the “major leagues” vs. the “minor leagues” – that it was easier to go from the “majors” to the “minors,” than vice-versa. He encouraged me to consider pursuing a faculty position at a major research university and suggested that I consider applying for faculty positions directly or a post-doctoral position as a step in that direction. By that time Direct Methods were proving to be successful, computing power was improving rapidly, and DEC (Digital Equipment Corporation) was coming out with its line of PDP laboratory computers. In fact, Jacobson’s lab got a PDP-11 just as I was leaving. One could foresee the time coming soon when determining a small molecule structure would be much easier and more automatic. The concept of small molecule crystal structure determination becoming a “departmental service” did not seem too far off. I felt I had ample training in physical chemistry and small molecule crystallography and decided that if I was going to do a post-doc, I would broaden my training into the relatively new field of protein crystallography. In the late 1960’s there were only a handful of protein structures known – the Protein Data Bank (PDB) had not been established yet (not until 1971) and by 1973 the PDB had only 9 protein entries (carboxypeptidase / ribonuclease / chymotrypsin / lactate dehydrogenase / subtilisn / Lamprey hemoglobin / rubredoxin / trypsin inhibitor / and cytochrome b5)!
Postdoc Years: I applied for and was offered a postdoc position in the laboratory of Prof. Michael Rossmann at Purdue University and soon afterward was awarded an NIH Post-doctoral Fellowship which paid a stipend of $6000/yr. At Purdue I worked on the structure of lactate dehydrogenases (LDH), which was one of the first half dozen or so proteins to have its structure determined. LDH is a multi-subunit enzyme that uses a common, niacin-dependent coenzyme – NADH or nicotinamide adenine dinucleotide. Almost immediately I became hooked on protein crystallography, and have enjoyed it ever since. Things went very well for me while at Purdue. It was an exciting and intellectually stimulating time. Michael had a large, international group of young scientists with new and exciting results coming out rapidly – looking back it was something like the “gold rush” period of structural biology – nuggets were everywhere just waiting to be discovered. Soon it was realized that the first half of LDH that bound NADH consisted of two copies of a sheet/helix/sheet/helix/sheet motif. This was initially described as a “super secondary” structural element. But when the structure of GAPDH (glyceraldehyde 3-phosphate dehydrogenase) was solved, it was realized that GAPDH and other nucleotide binding proteins also bound their nucleotides at the C-terminal end of a similar motif, it was soon called the nucleotide binding domain now commonly known as the “Rossmann Fold”.
When I went to Purdue I had strong training in crystallography, but was weak in biochemistry. However, I enjoyed working in the wet lab doing protein isolations, enzyme assays, etc. This was when data was collected on precession photographs using a sealed tube X-ray generator – before ready access to rotating anode generators or synchrotron sources. Lactate dehydrogenase was a relatively large protein for those times, which meant that you needed to grow BIG crystals. The use of hanging drops was not yet in play. We grew our protein crystals in small vials that typically held a quarter to a half mL of protein solution that often yielded protein crystals 0.3 to 0.5 mm on edge or larger, so we ran through hundreds of mg of protein. Since we also did not have the molecular biology tools back then, we looked for natural sources that were rich in the protein of interest. When I started to work on the heart isozyme form of LDH, I recall making many an early morning run to the meat packing plant in Indianapolis to collect 20 pounds of pig, beef or chicken hearts to be taken straight from the fresh animal carcasses, dropped directly into my ice chest, then making the return trip to Purdue to begin the first full day of the enzyme isolation. This involved using a professional sized meat grinder, working with buckets of buffer, and using kilograms of ammonium sulfate for salt precipitation steps.
Data collection was also changing rapidly in the early 1970’s. We collected data on precession films, then on a 4-circle Picker diffractometer, but the demand for faster data collection to meet the needs of protein crystallography was leading to many changes in hardware such as using rotating anode generators that resulted in about a ten-fold increase in source intensity. The popularity of rotating anode sources came with a whole new set of maintenance issues involving vacuum seals, water pumps, oil diffusion pumps, etc. Diffractometers were improving too. Instead of having to set all the angles by hand and baby sit the diffractometer during data collection, we had a semi-automated diffractometer that was connected to a computer card keypunch. The setting angles were read by the keypunch from the computer cards and stepping motors then set the angles. However, those stepping motors were notorious for getting dirty and required lots of maintenance. The intensity data were punched on a computer card so when the diffractometer worked, you simply had to monitor it. Data collection was still relatively slow, and it was not uncommon to have to use 8 or more crystals to collect a complete data set. Later we had a computer controlled diffractometer, run by a PDP 8e that had only 4K bytes of memory with no keyboard or display. It was booted with toggle switches. A punched paper tape had to be read to instruct the computer to carry out each different operation. However, all this was relatively short lived. Soon the advantages of using film and its ability to measure hundreds or thousands of reflections at a time by the oscillation method became popular, followed closely by the use of synchrotron radiation to increase the source power by several more orders of magnitude enabling the use of much smaller crystals and greatly increased speed of data collection.
Phase determination was also changing rapidly in the 1970’s. Phases for LDH were determined by the MIR (Multiple Isomorphous Replacement) method that Michael had helped develop with Max Perutz while working on the structure of hemoglobin while he was at Cambridge. Michael had also helped develop the Rotation Function, so working on large proteins with non-crystallographic molecular symmetry especially appealed to him. GAPDH was also a tetramer, but with non-crystallographic symmetry. The first maps of GAPDH were not very encouraging. However, the signal to noise improved greatly once symmetry averaging was applied which enabled the chain to be traced. Michael immediately saw the enormous advantage of symmetry averaging and soon thereafter started focusing on virus structures. His interests in viruses was helped by it being observed in another lab at Purdue that crystals of Southern Bean Mosaic Virus (SBMV) would form in the centrifuge tube simply by concentrating the virus during high speed centrifugation. Another major contribution of Michael to the field was to develop the Molecular Replacement method of obtaining initial phases using a known related structure that could be oriented and positioned within the new unit cell using the Rotation and Translation functions. As more and more related structures were being worked on, Molecular Replacement soon replaced MIR as the most popular way to obtain starting phases for new protein structures.
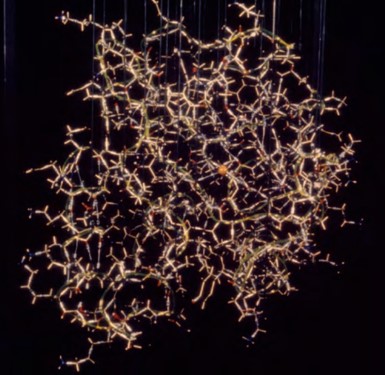
Finally, it should be mentioned that things were changing rapidly with respect to computing power and graphics capabilities. The first protein models were small, low resolution tracings of electron density contours on stacked sheets of glass or Plexiglas. It was also popular to build a small model obtained by tracing the electron density onto sheets of balsa wood which were then cut out and glued together to create a physical model. Since molecular computer graphics capabilities were not yet available, building an atomic physical model of a complex protein was a tremendous challenge, although John Kendrew had popularized using model parts to build models of myoglobin. While on sabbatical in David Phillips' laboratory for structural biology at Oxford in the late 1960’s, Fred Richards (Yale University) came up with an idea to simplify the process by introducing the use of a half-silvered mirror to build the physical model. This arrangement known as a ”Richards Box” or “Fred’s Folly”, quickly became popular. It was used in conjunction with brass “Kendrew” model parts to assemble a physical model that could be hand-fitted to the experimental electron density. The basic components of tetrahedral carbons, peptide bond units, and one-piece units for rigid groups like are aromatic rings of phenylalanine, tryptophan, etc. were used to construct the model at the scale of 2 cm = 1 Å. The electron density sections were traced onto large glass or Plexiglas sheets; the size of glass sheet needed was determined by the size and shape of the protein. For LDH, we used glass sheets that were 1 m x 1.5 m allowing one to work within 50 Å by 75 Å size restraints. A Richards box consists of multiple parts: a) the cage where the model was to be assembled, b) a similar sized region to hold the working sections of electron density, c) a third bay to hold the rest of the electron density sections not being worked with, d) a half-silvered mirror between the build volume and the working electron density sheets, and e) light boxes – one behind the working electron density sections and another light source to illuminate the model build slice that was being assembled. Working in a dark room with a few sections of the working electron density in position behind the half-silvered mirror illuminated from the rear enabled the electron density sections to be viewed through the mirror. Using a second spot light to illuminate the corresponding working area in the model cage, one could view the reflection of the brass model parts in such a way that the reflection of the brass model parts from the half-silvered mirror appeared to be superimposed into the electron density sections behind the mirror. Normally, one could work with just one or two amino acid residues at a time. Once positioned, the model parts needed to be clamped to support rods and all the screws tightened to lock in the torsion angles. Decent resolution was about 2.5 to 3 Å resolution in those days, and a skilled crystallographer could build about 2 to 3 amino acid residues per hour in this manner. Thus it could easily take a couple of months to build a model of a relatively large protein. It should be noted that the size of protein that this method could be applied was limited by reach of one’s arm. Once the model was built, it often had to be readjusted since parts would get bumped and moved as hands moved in and out to inspect the model.
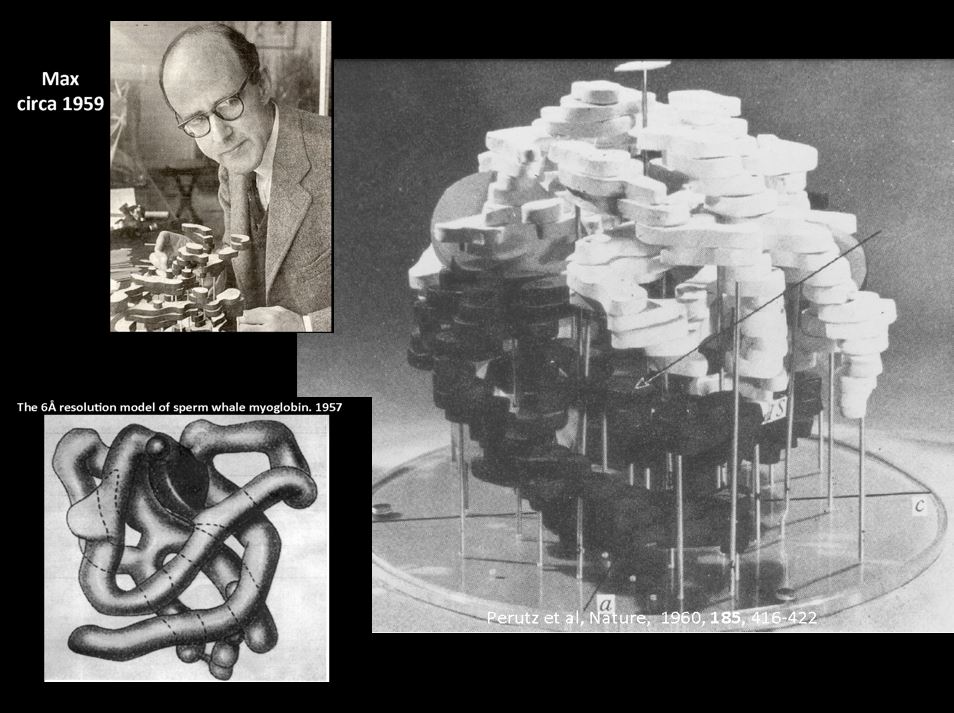 Max Perutz and early Hb models.
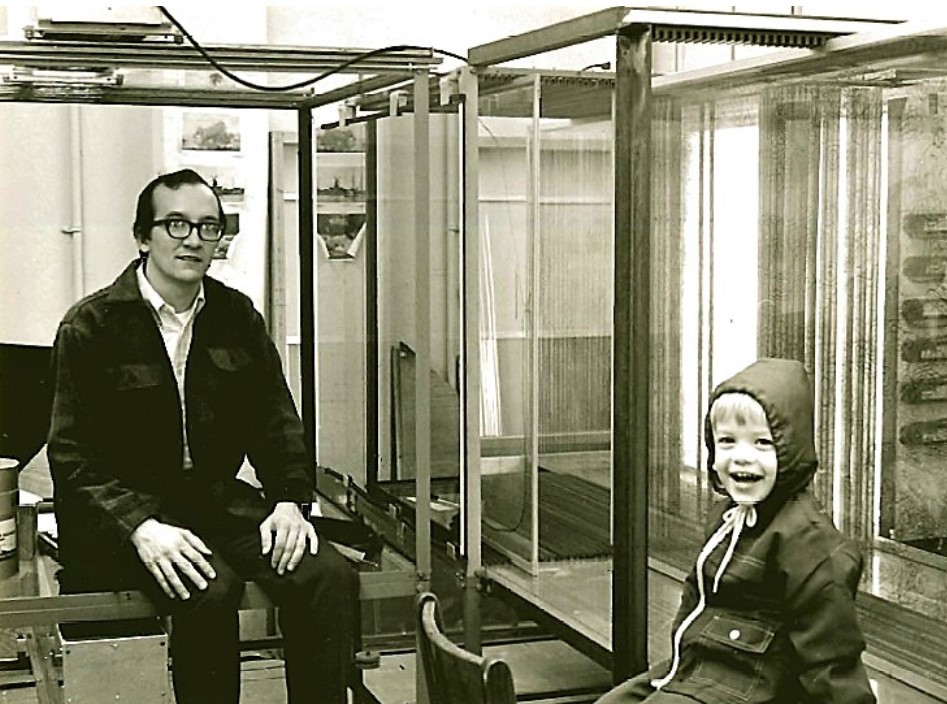
Marv & son Chris building a Richards Box.
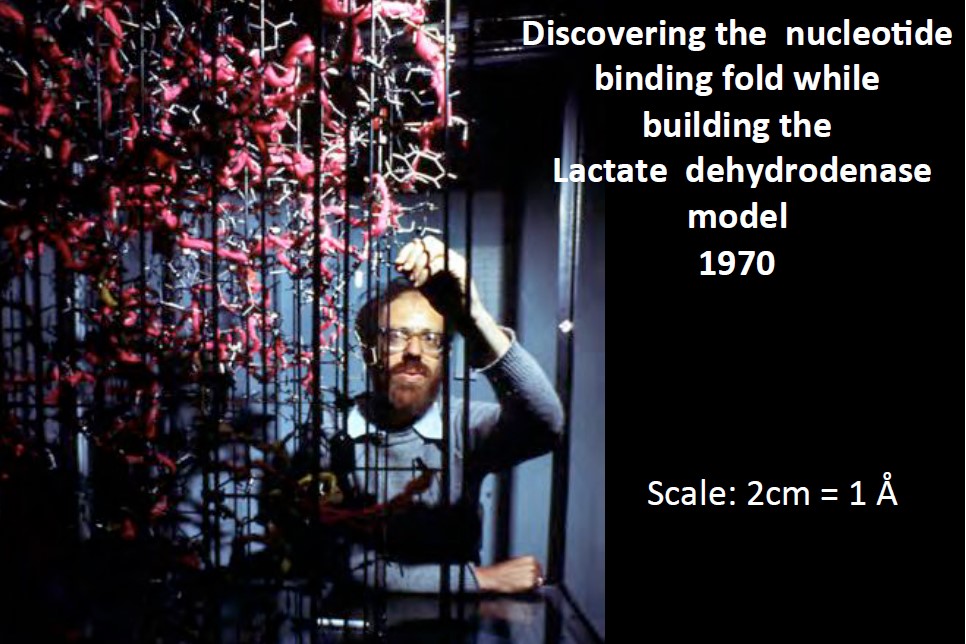
Michael Rossmann with LDH model.
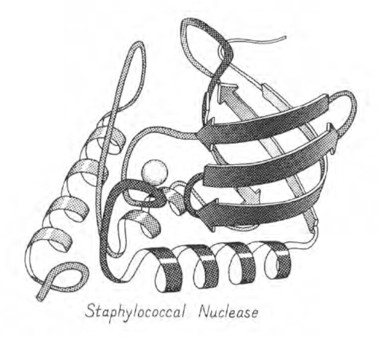
A Richard’s box resulted in a physical model, but did not provide xyz coordinates of the model. To obtain coordinates, we used a pair of glass plates marked with an xy grid. Using a small light source on the end of a pointer that could be held near an atom center, and the xy coordinates could be estimated by reading the xy coordinates off the aligned grids and the z coordinate could be estimated based on which slice of electron density appeared to be closest. This was a very slow, inaccurate and tedious job. It helped to have an assistant who could record the coordinates as they were called out. These rough initial coordinates would then be used in a program like Diamond Refinement to generate a set of model coordinates with improved stereochemistry for study and analysis, that could be used with ORTEP or other plotting programs to generate figures for study and publication. It should be noted that these carefully built, “correct” models often resulted in starting R-factors of 50 to 55%! The resulting figures were still very complicated and it soon became desirable and popular to create artistic, hand renderings of the protein structure by representing strands of beta-sheet as directional arrows and helices as either a coiled ribbon or a cylinder. These schematic ribbon diagram representations were easier to grasp and understand the fold of the protein. Some crystallographers, such as Jane Richardson, became well known for their skills in doing this – generating useful images that were also beautiful pieces of art in the early 1980’s. In the decade to follow, computer and computer graphics programs like Ribbons and others had advanced to the stage to make much of this hand drawn work unnecessary, although not obsolete.
 Model of Staphylococcal nuclease: Kendrew model.
Model of Staphylococcal nuclease: Arrows & Ribbons representation.
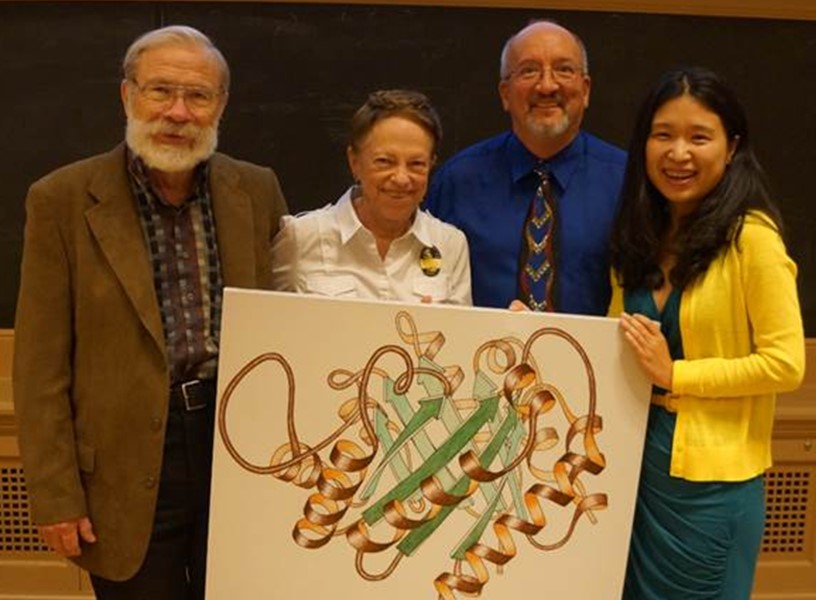
Work of Art (with Dick and Jane Richardson, Marv Hackert, Yan (Jessie) Zhang – 2013).
I have many fond memories of working in Michael’s lab, the people I worked with there and of living in W. Lafayette. By my third year at Purdue, I had been to meetings in Europe twice, had met Nobel Laureates like Max Perutz, James Watson and Francis Crick, and had been an invited speaker at an International Biochemistry Congress in Moscow. Michael was a great mentor and one of the hardest working, most competitive and driven scientist that I have had the pleasure to be around. His enthusiasm for both science and life was amazing and contagious. Whether it was learning about viruses, learning to sail or hiking in the mountains – Michael was always “all in”. Michael’s lab and that of Struther Arnott were very international in their make-up – we worked hard, but enjoyed ourselves too. Many of us lived in Purdue housing near campus conveniently only a few blocks from the lab. Anders Liljas and his family lived next door, Mitchell Guss from Struther Arnott’s lab lived just around the corner, and Jeff Ford and Jan White lived just a short distance away.
I was very happy at Purdue, but then one Saturday morning an event happened that again changed my life. I went into the lab to work and discovered a letter inviting me to visit and interview for a faculty position at a great place that was expanding its protein crystallography program. Soon thereafter, I received a second such unsolicited invitation to visit The University of Texas at Austin. At the time I was not looking for a job because Purdue had discussed my taking on a faculty position at the end of my NIH Fellowship. I have many fond sayings, like – “Sometimes it is better to be lucky than smart.” It helps to have some of both, but I feel I have been very lucky in life. I am one of the few people I know that did not have to initiate a formal application for a faculty position. I went on two interview trips, received two job offers, liked the opportunities and the people at both places, and decided to take the position at The University of Texas at Austin – home of the Texas Longhorns and over 40,000 students – quite a difference from the one-room country school house where I began my education. Before leaving Purdue, I am proud to have started what became a lasting tradition in Michael’s lab. In 1973 I took the first Rossmann group lab photo using a timed delay exposure with my camera propped on top of a file cabinet in the conference room outside Michael’s office. That started a tradition that continued for many, many years.
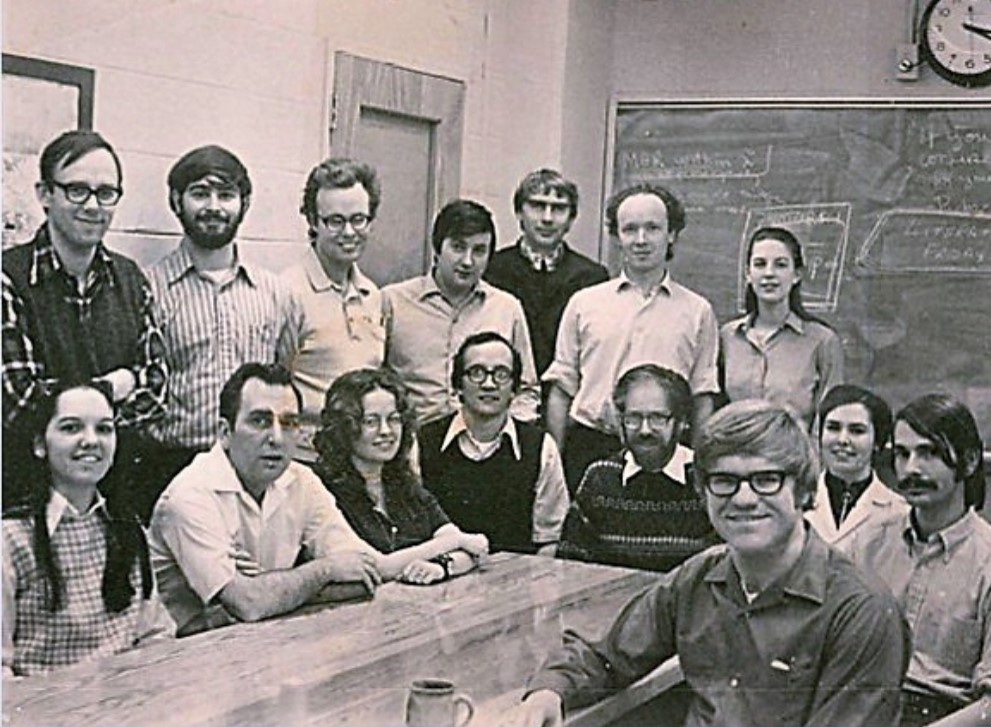
First Rossmann Purdue Lab Group Photo (1973): seated – Sharon Wilder, Ira Smiley, April Adams, Marv Hackert,
Michael Rossmann, Mary Ann Wagner, Bill Eventoff and Jack Johnson;
standing – Anders Liljas, Steve Steindel, Ken Olsen, Dino Moras, Manfred Buehner, Geoff Ford and Jan White.
University of Texas: I arrived in Austin in January of 1974 as a new Assistant Professor of Chemistry. UT-Austin did not offer any biochemistry degrees at that time, but UT had Professors Stan Simonsen, Hugo Steinfink and Ray Davis running crystallography labs and a great group of biochemists led by Roger Williams, William Shive and Lester Reed. Much of the biochemical research at UT had grown out of the pioneering efforts of Roger Williams on the discovery and isolation of vitamins with funding support from a mix of federal sources, the Welch Foundation and the Clayton Foundation.
UT hired a second young protein crystallographer named Jon Robertus who had worked with Joe Kraut at UCSD and was coming from a postdoc with Aaron Klug where he worked on the structure of t-RNA. Another appeal of accepting the offer from the University of Texas was that they had the nucleus of a protein crystallography lab put into place by David DeRosier who had just left UT to accept an opportunity to join Don Casper and other structural biologists at Brandeis University. Jon and I jointly inherited an equipped biochemistry lab, an X-ray lab with a GX-6 rotating anode generator, and a PDP 12 lab computer connected to an unusual flat-bed densitometer that David had equipped with a fiber optics light system to measure film intensities. For me personally, one of the main attractions of coming to UT was the opportunity to work with Lester Reed on the structures of the pyruvate and a-ketoglutarate dehydrogenase multi-enzyme complexes (the mammalian PDC is larger than the ribosome!). Unfortunately, those complexes did not want to crystallize. However, I quickly established a number of other collaborations and was able to obtain crystals of an unusual invertebrate hemoglobin and a photo receptor protein called C-phycocyanin. Cele Abad-Zapatero, John Priestle and Mike Carson were my first graduate students. Cele worked on the photoreceptor protein C-phycocyanin, went on to do a postdoc with Michael Rossmann at Purdue, then had a long career in drug discovery with Abbott Laboratories and is currently an Adjunct Professor with the Center for Biomolecular Sciences at the University of Illinois at Chicago. Cele is also well known to our ACA community for having contributed many articles to ACA RefleXions and for his contributions at the interface between symmetry, art and science. John Priestle joined Hans Jansonius in Basel, and stayed in Switzerland working in the pharmaceutical industry. Mike Carson joined Charlie Bugg’s lab at University of Alabama Birmingham where he remained for many years. Mike created one of the early molecular schematic ribbon diagram programs called Ribbons, and continued to focus on new approaches to molecular modeling use in structure-based drug design by displaying protein structures using computer graphics in ways that better enabled non-crystallographers think about drug design.
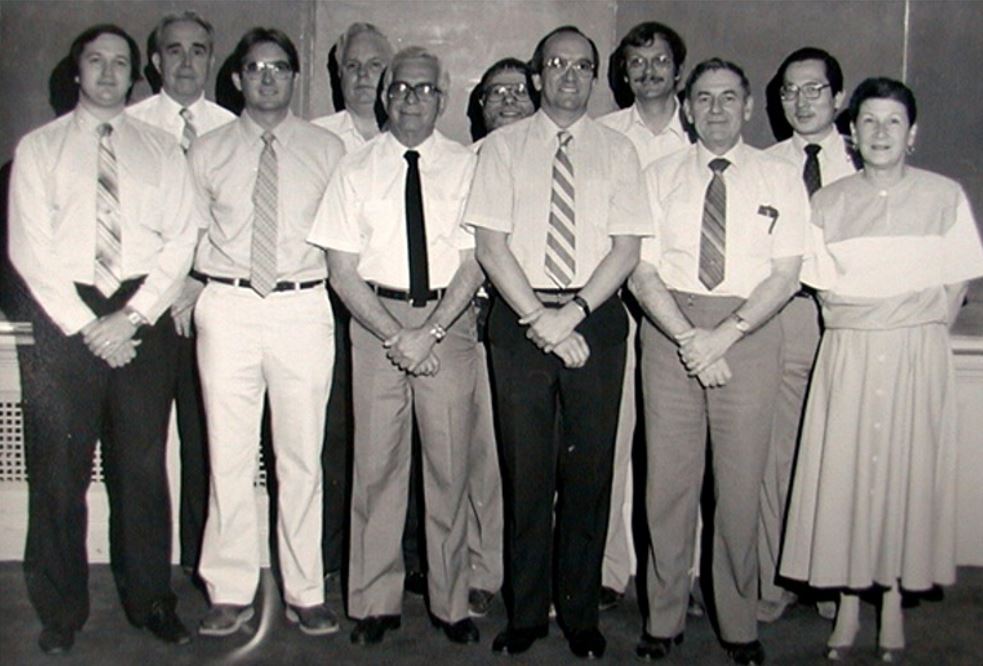
UT Biochemistry Division 1987 – Dale Mosbaugh, William Shive, Dean Appling, Boyd Hardesty, Lester Reed,
Barrie Kitto, Marv Hackert, Jon Robertus, Dan Ziegler, Kuan Wang, Joanne Ravel.
Between 1975 and 1985, the field of protein crystallography was again impacted in major ways by advances in computing, molecular graphics, X-ray sources, detectors, and advances in molecular biology methods. In the mid-1980’s we acquired our first laboratory computer, a VAX-11 with a half Megabyte of memory, a tape drive plus two countertop high hard drives where each large platter stored only 32 Megabytes of data (less than on any thumb drive you would buy today for a few dollars). The VAX needed special air conditioning and occupied about ~9’x2’x6’ of lab space and cost over $100,000. We also purchased an Evans & Sutherland black & while vector graphics display system to use for molecular modeling for another $100,000. Today, for around $1,000 or less, one can purchase a laptop computer with far more computing power, storage and graphics capabilities (and in color) than what cost us nearly $250,000 in the 1980’s!
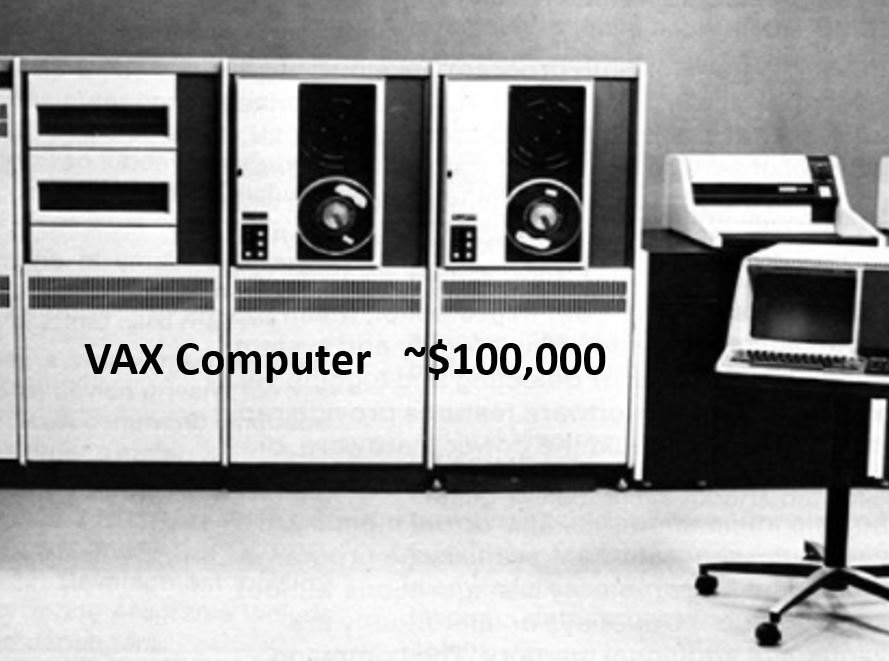
Hardware (late 70’s early ‘80’s): VAX 11 lab computer.
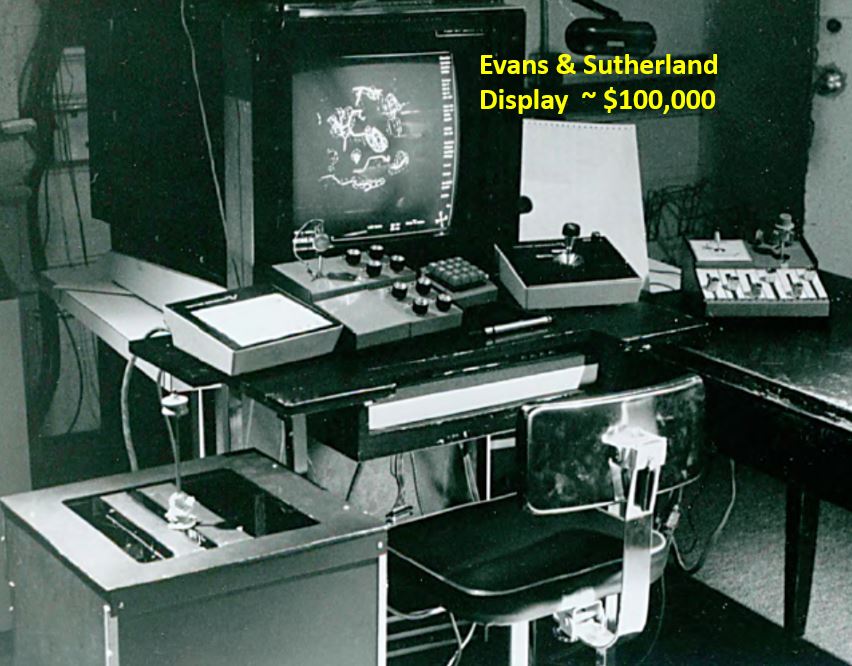
Hardware (late 70’s early ‘80’s): Evans & Sutherland Graphic Display
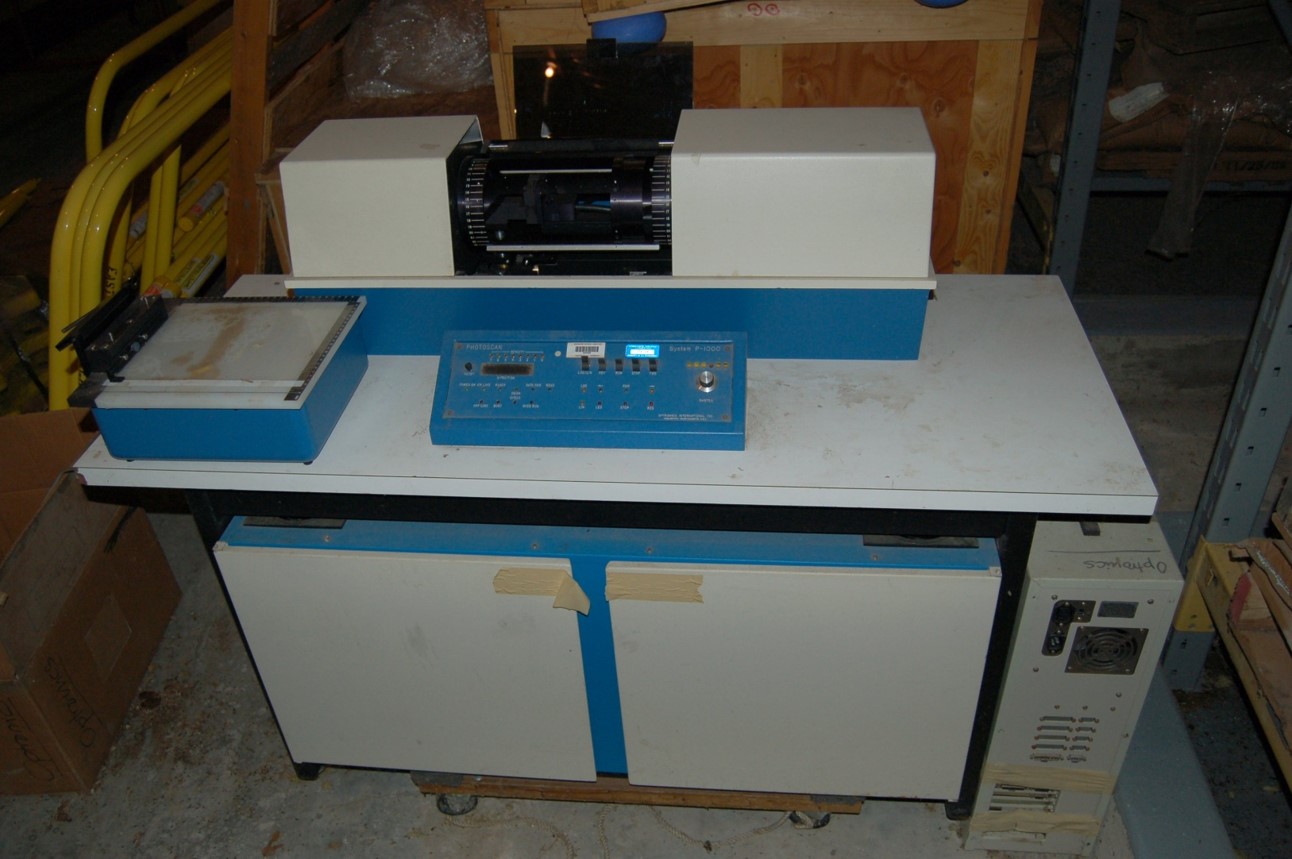
Hardware (late 70’s early ‘80’s): Optronics Film Scanner
We obtained an automated, 4-circle diffractometer for data collection equipped with a long detector path filled with helium to cut down on air scattering and boost the signal at the detector, but soon it was obvious that the in-house data collection method of choice was to have a rotating anode X-ray source paired with a rotation/oscillation camera to collect data on film. The oscillation method had the advantage of not using a layer line screen as was needed to obtain a precession photograph, thus more data could be collected from a crystal before radiation decay took its toll on the data quality. Since exposures were relatively short, the camera held several cassettes. We routinely loaded two pieces of film into each cassette so the very strong reflections that would have been overexposed and saturated the first piece of film could be more accurately recorded on the second piece of film. This resulted in using a lot of X-ray film, dark room solutions, and required having some form of densitometer to obtain the spot intensities. We had an Optronics rotating drum scanner that was remarkably fast and robust. Processing on the films and getting the spot shape and background areas defined properly was still a lot of work.
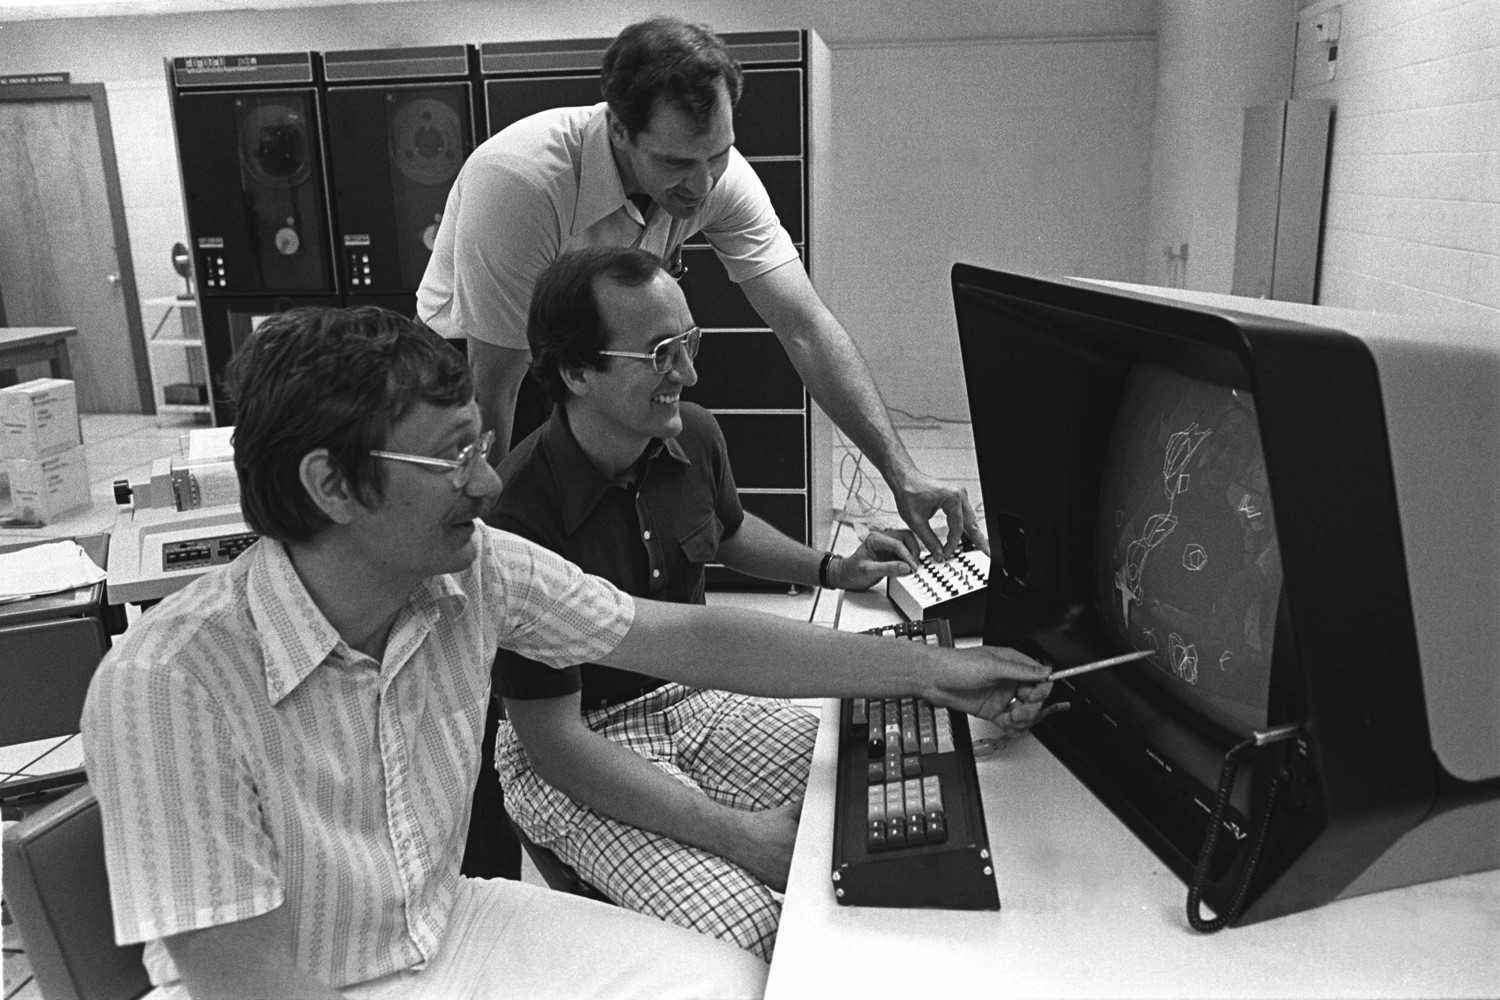
Jon Robertus, Marv Hackert, Steve Ernst – UT Vector General graphics B&W display (~$250K) in 1978.
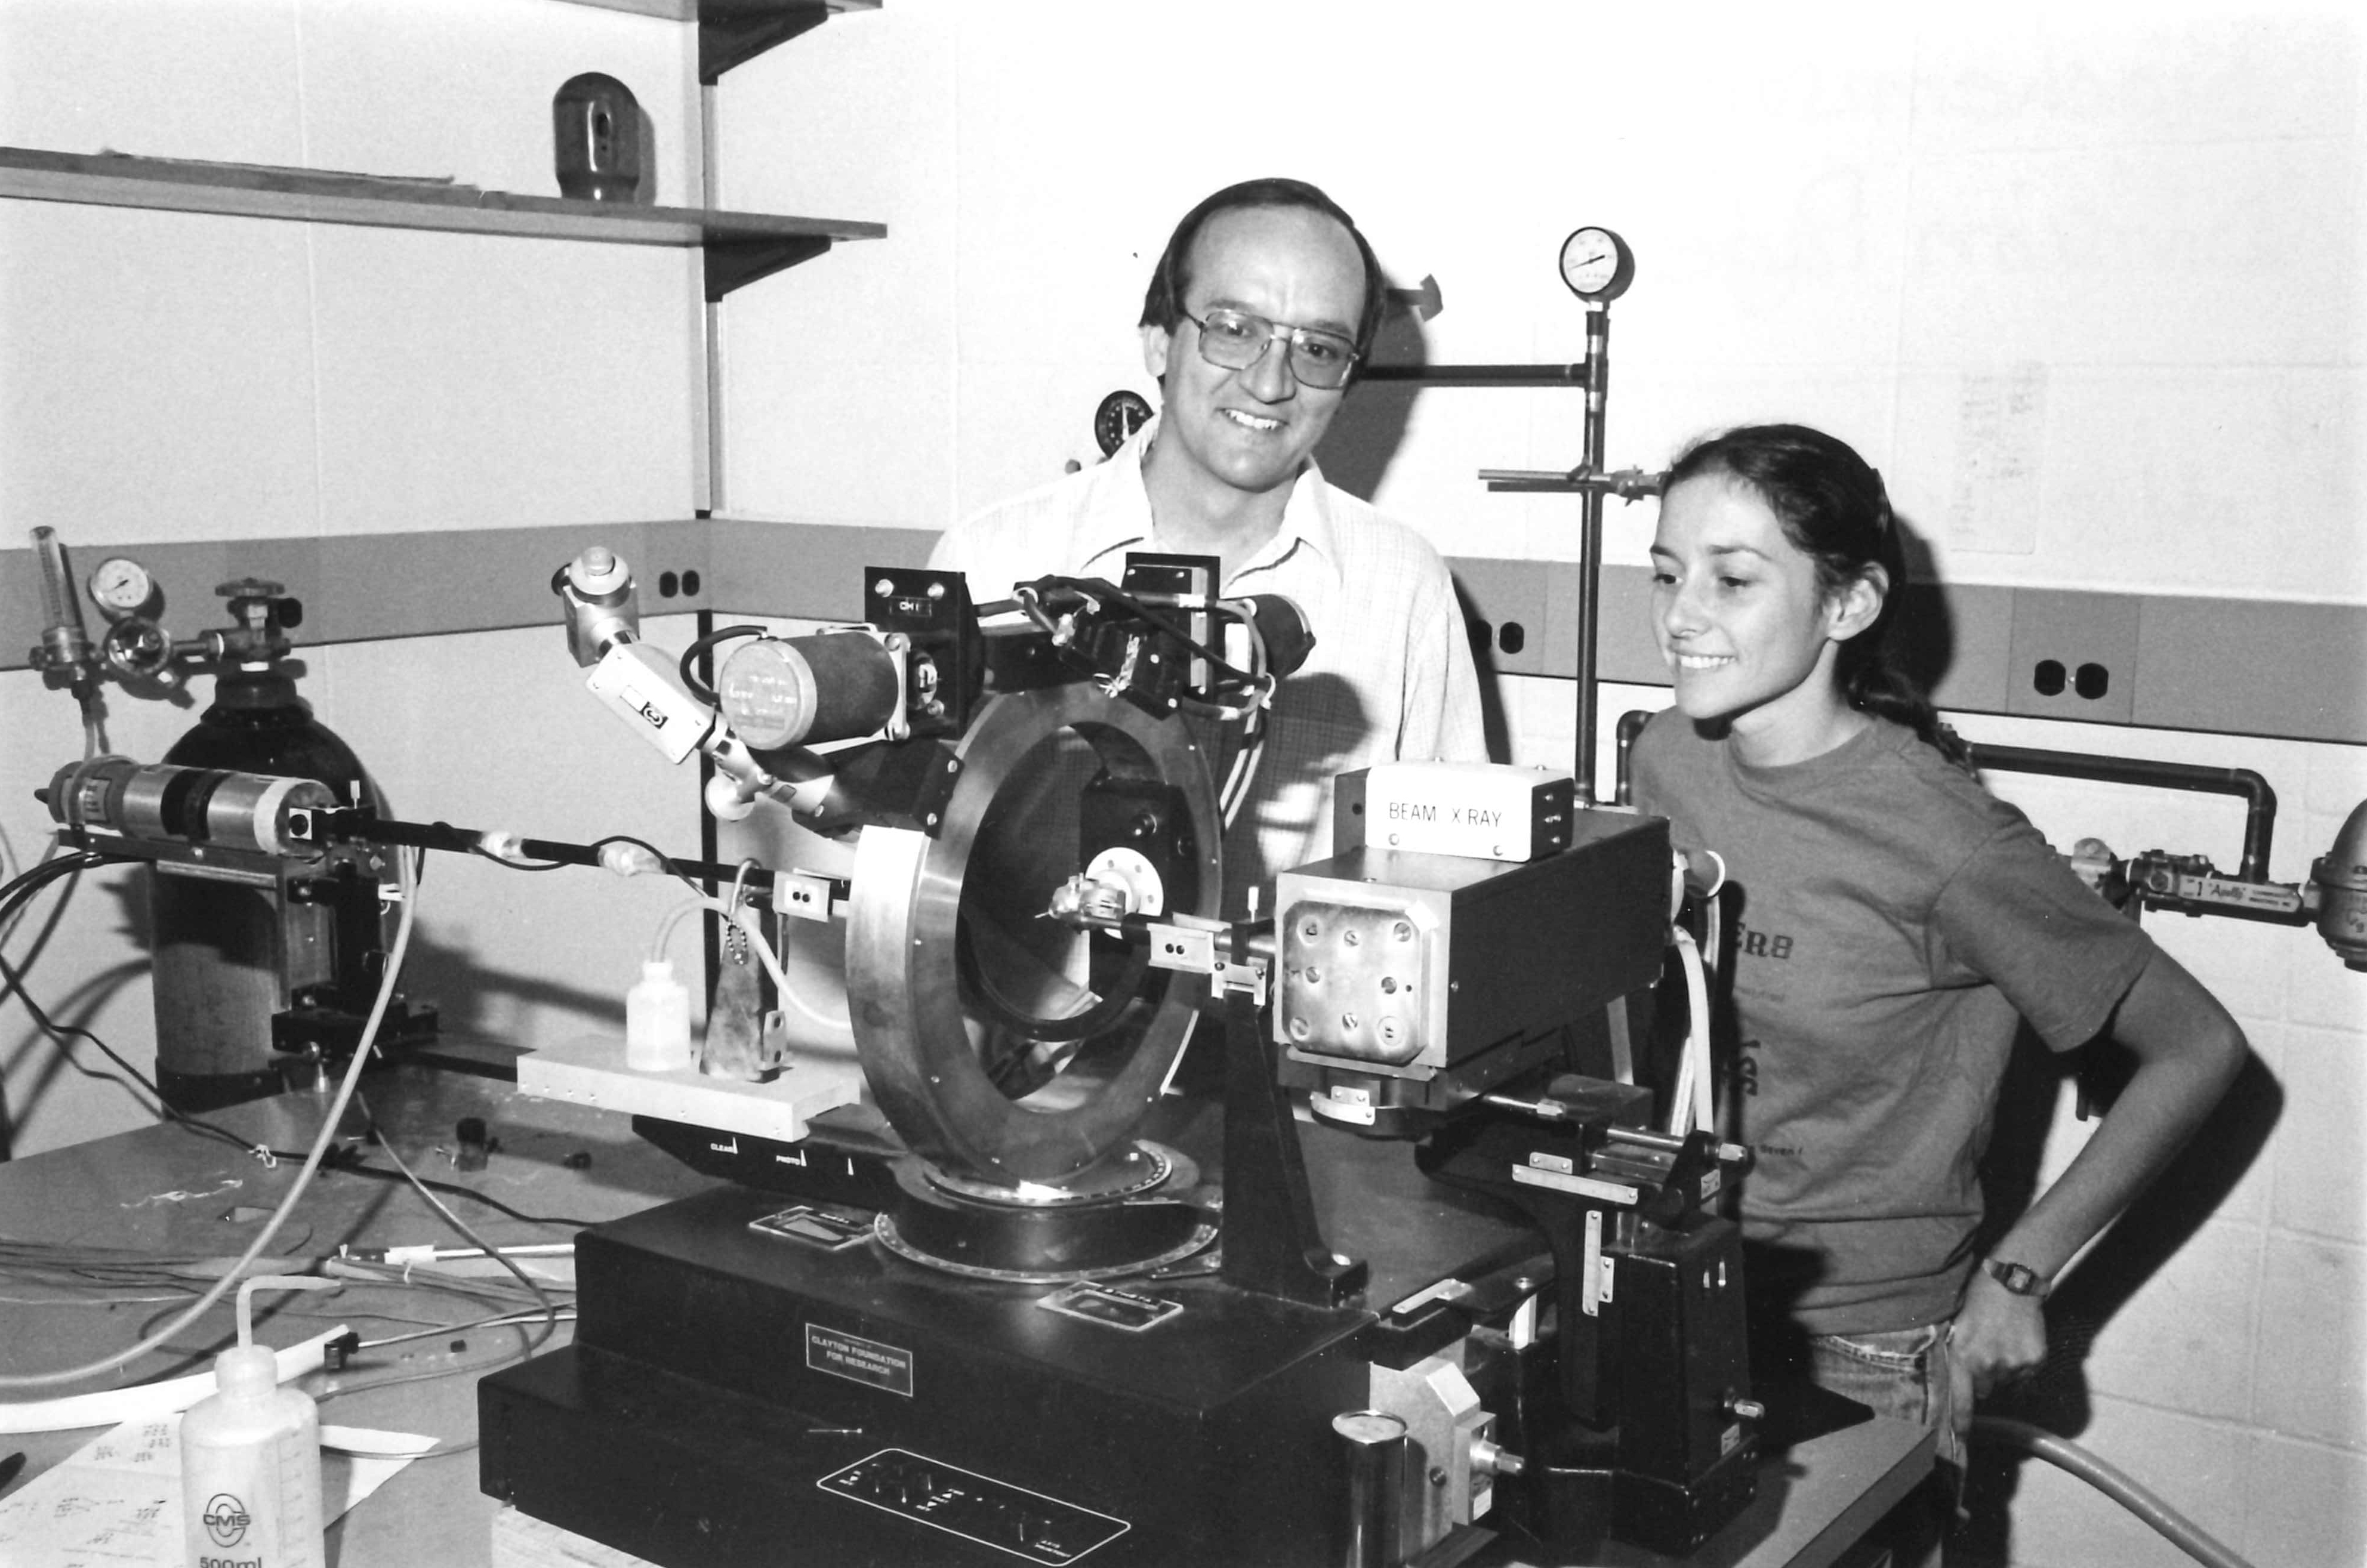
UT 4-circle diffractometer - with graduate student Robyn Stanfield (1984).
During the 1980’s I was asked to serve on a NIH review panel to review proposals for new detector technologies. Area detectors were being developed by physicists in multiple laboratories, but in particular there was the group in San Diego at UCSD led by Prof. Xuong Nguyen-Huu with the expert assistance of Ron Hamlin on hardware and Chris Nielsen on software to develop multi-wire area detectors – sort of a large sized film replacement that provided digital readout of intensities. In 1983, they formed a company called ADSC to produce multi-wire area detectors. The idea of the area detector approach was inherently attractive and easy to understand, but real success on unknown systems was hard to come by.
Their work was funded for detector development, but with a provision that they accept a certain number of outside users to bring their crystals to UCSD to collect data. We had been working on the structure of an unusual histidine decarboxylase (HDC), applied for and were awarded a slot to collect data. I and two of my lab mates took crystals of HDC to Xuong’s lab at UCSD. It was an amazing experience. The detectors were mounted on TV camera stands that had to be positioned by dragging them by hand across the floor to set the approximate theta angles by reading positions from hand markings on the tile floor! Xuong and Ron Hamlin were working to build better wire detectors while Chris focused on the software to extract the data. They were also working on building a “big wheel” copper rotating anode generator that would be able to produce a more intense beam of X-rays. The bottom line was that it was both an educational and successful trip. The data we collected on the native and potential heavy atom derivatives of HDC were used to solve the structure. The success of the multi-wire detectors soon led to a surge in applications for data collection time on their system. Along with Brian Matthews and David Davies, I was asked to serve on the external advisory committee for the UCSD facility from 1986-1995. We would review the progress on detector development and evaluate and rank the applications for beam time. As a side note, serving with David and Brian on this and other review panels was always a pleasure.
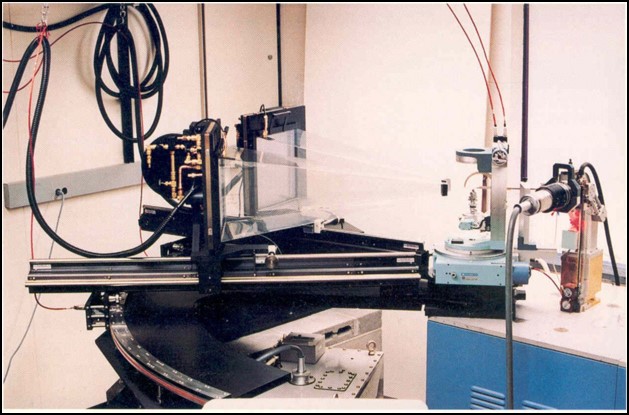
I was so impressed with the speed and quality of the data being collected at the UCSD facility, I naively started advocating for replicating their multi-wire facility at a few locations around the country at institutions near major airports like Boston, Washington, Chicago, Atlanta, Dallas, etc., believing that only a few such facilities could satisfy most of the data collection needs of the entire macromolecular crystallographic community in the country. Even if you could collect data for your structure in a few days, it would take months to build the structure, refine it and analyze the results. But things were continuing to change very rapidly. Computers were getting faster and cheaper and robotics were developed to help with setting up crystallization plates and for use in data collection. Molecular biology tools became available to express large quantities of new protein targets, histidine tags could be added to facilitate easier isolation of the protein, and site-directed mutants could be produced to test our understanding of mechanisms. Funding to explore all of protein folding space spurred additional growth, so soon there was demand by many laboratories to have their own area detector systems. I was fortunate to have applied for and was funded for a shared instrumentation grant to install a two detector system at The University of Texas at Austin. Having dealt with the uncertainties associated with having to drag detectors on camera stands across the floor, we wanted a motor driven 2-theta table to accurately position the two-theta positions of the detectors. Ron produced a large, aluminum anchor shaped detector base equipped with stepping motors to move the detectors. The system worked great, was beautiful and a photo of our system was the cover shot from their sales brochure for several years after that.
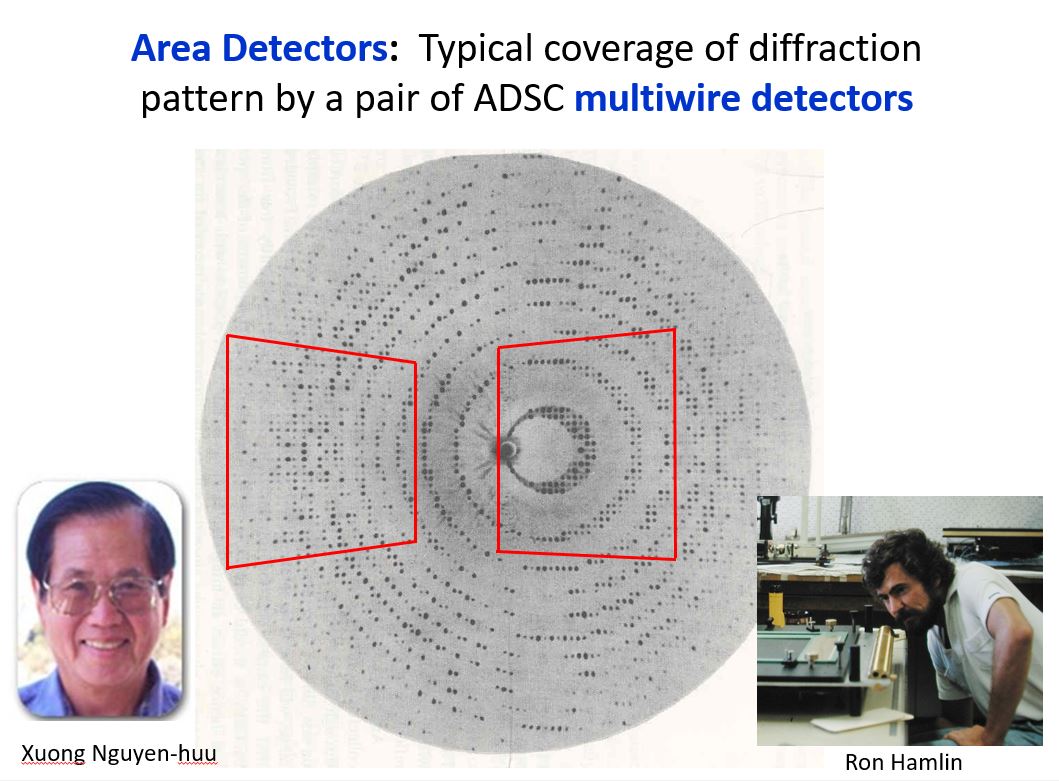
Xuong and Ron Hamlin – Area Detector Systems Corp (ADSC).
Univ. of Texas motor driven 2-theta table ADSC system.
Service to UT: I have had a very rewarding research and teaching career at The University of Texas, but probably will have had the biggest impact with my service contributions. I have trained over 20 PhD students, worked on a variety of structures and taught everything from freshman chemistry and baby biochemistry for nurses and nutrition majors, to senior level and graduate courses in biochemistry, biophysical methods and crystallography. However, many years ago I discovered the joy and blessings from working with others to make things work better and the satisfaction of knowing that you can accomplish and bring about change through administration that one cannot do as an individual faculty member. I have now been at UT-Austin for nearly 47 years, along the way I have been elected or asked to serve as head of the Biochemistry Division, Director of the Biochemical Institute at UT, Graduate Advisor and then Chair of my Department, Chair the Graduate Assembly, Chair the Faculty Council, Chair of the University Faculty Budget Oversight Committee and Associate Dean and interim Dean of the Graduate School. During my time leading the Biochemistry Division we created degree plans in Biochemistry that soon became very successful and popular undergraduate Biochemistry BA and BS degrees, along with PhD and Masters’ programs at the graduate level. During my time as Chair of the Department, we hired 16 new faculty members, many of whom have made distinguished careers and major contributions in their fields. Since then UT has hired an outstanding group of structural biologists to carry on studies in Structural Biology - Drs. Jessie Zhong, Adrian Keating-Clay, Jason McLellan, David Taylor and Dan Leahy in our department. The torch has been passed!
In 2005, I was asked to be Associate Dean of the Graduate School and Director of its Faculty Development and Graduate Fellowship Programs. The job came with a nice office in the Main Building, an opportunity to support and encourage hundreds of faculty and students along their career paths with research leaves, travel grants, or fellowships, a wonderful and experienced staff of co-workers, and great parking privileges that most faculty members could only dream about. Still, I was hesitant to accept the position because I was concerned about the potential impact on my identity as a faculty member (moving to the “dark” side). However, I took the job and have found it rewarding. One of my “other duties as assigned” tasks as Associate Dean was to Chair the Building and Programming Committees to build a DELL Pediatrics Research Institute (DPRI) at UT following a gift of $50M by Michael and Susan Dell. At the time, UT Austin did not have a medical school. I worked closely with several Deans from across campus and health officials at UT System to design and build what we were hoping to be the first building to plant the seed of a future Medical School at UT Austin. We built the DPRI building, but then the economic downturn of 2008 stalled the process. However, about six years ago with funding support from the citizens of Austin and UT System, the Dell Medical School at UT Austin was created and the first class of MDs graduated spring 2020. In 2015 I was asked to serve as interim Dean of the Graduate School and not long after decided to shut down my laboratory. I had already stopped taking new graduate students and was comfortable that we had a great group of next generation structural biologists to carry on the work at UT. I served as interim Dean for over two years and I am proud of the changes we were able to implement during that time.
During the IYCr in 2014, we celebrated 40 years of protein crystallography at UT in the Hackert and Robertus labs with a reunion symposium. Jon retired the following year. Today my work is mostly administration, both at UT and within the crystallographic community. Besides some limited teaching, I acquired a 3D printer and enjoy designing and printing 3D molecular models for classroom teaching and research use.
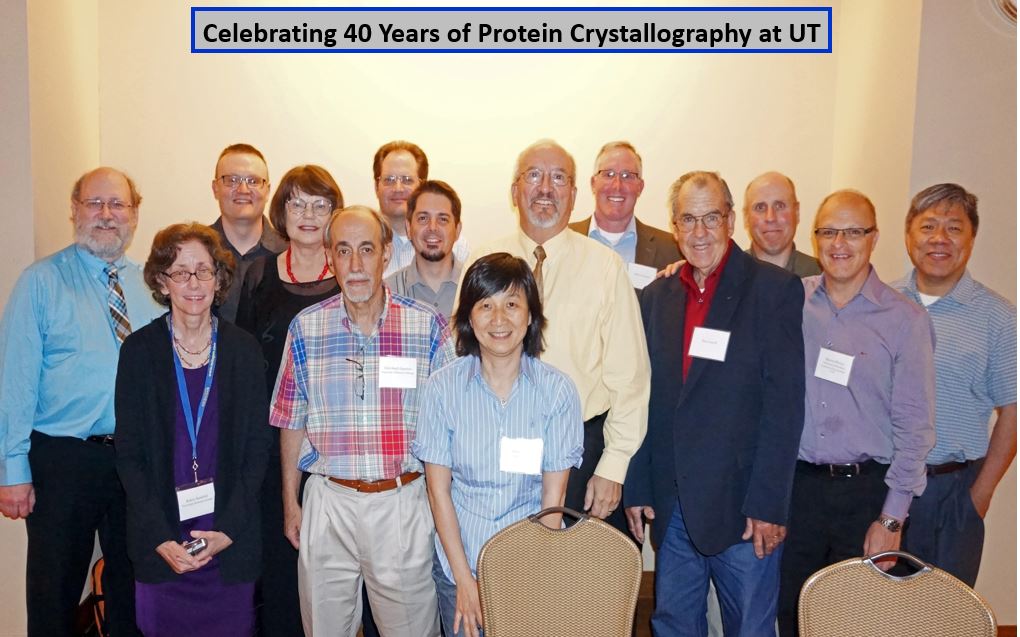
Celebrating the IYCr 2014 and 40 years of protein crystallography at The University of Texas at Austin with Hackert alums –
K. Clinger. R. Stanfield, P. Golubkov, M. Miller, C. Abad-Zapatero, J. Knapp, A. Taylor, N-L. Chang, Marv H,
J. Almrud, D. Carroll, D. Mitchell, M. Oliveira, and C M Huang.
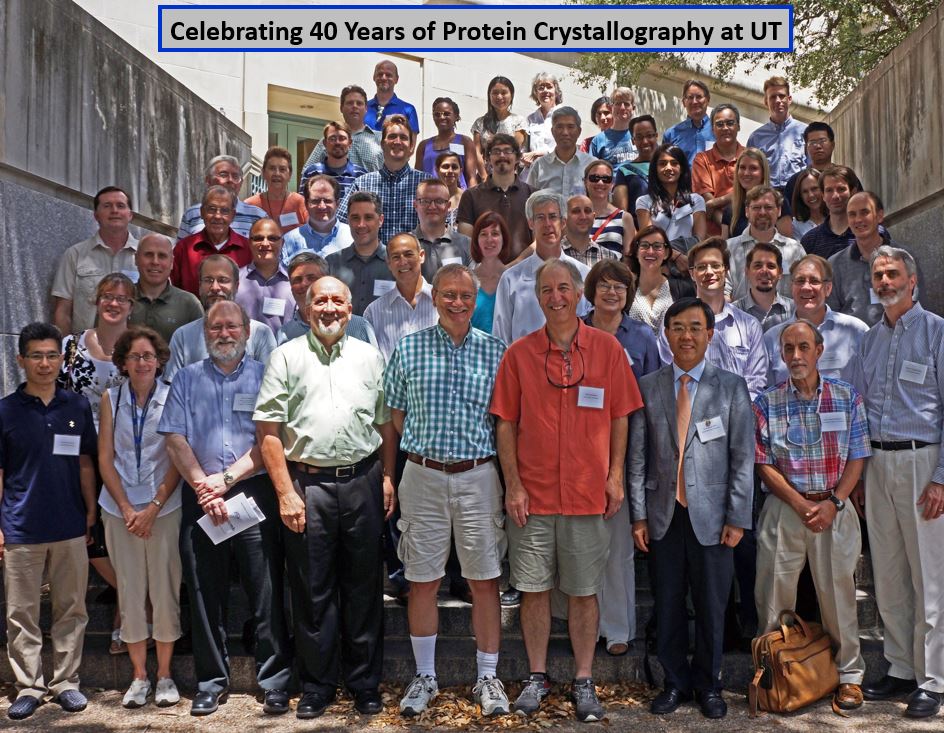
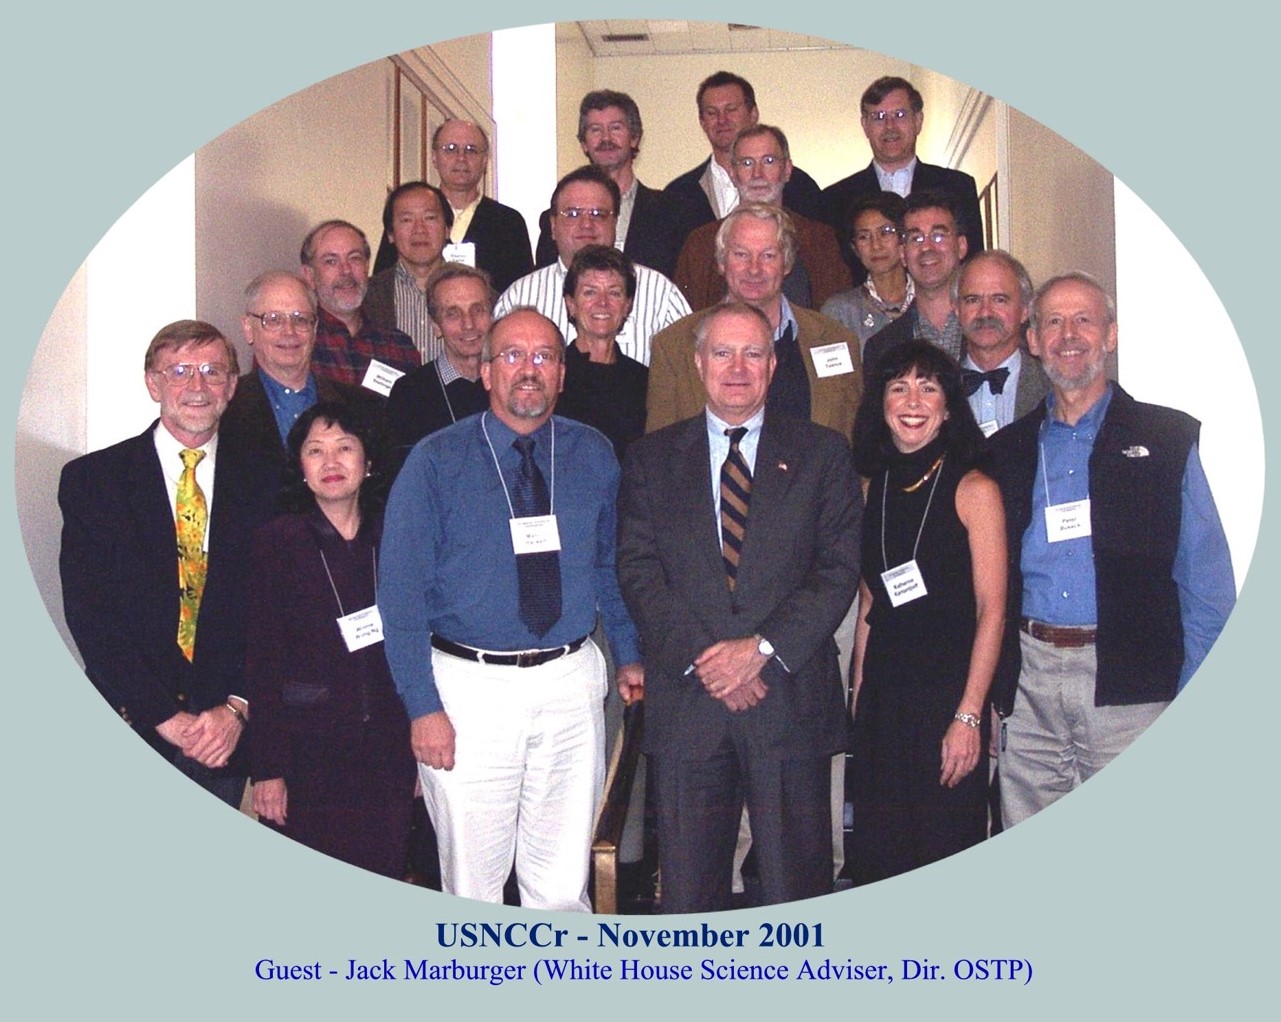
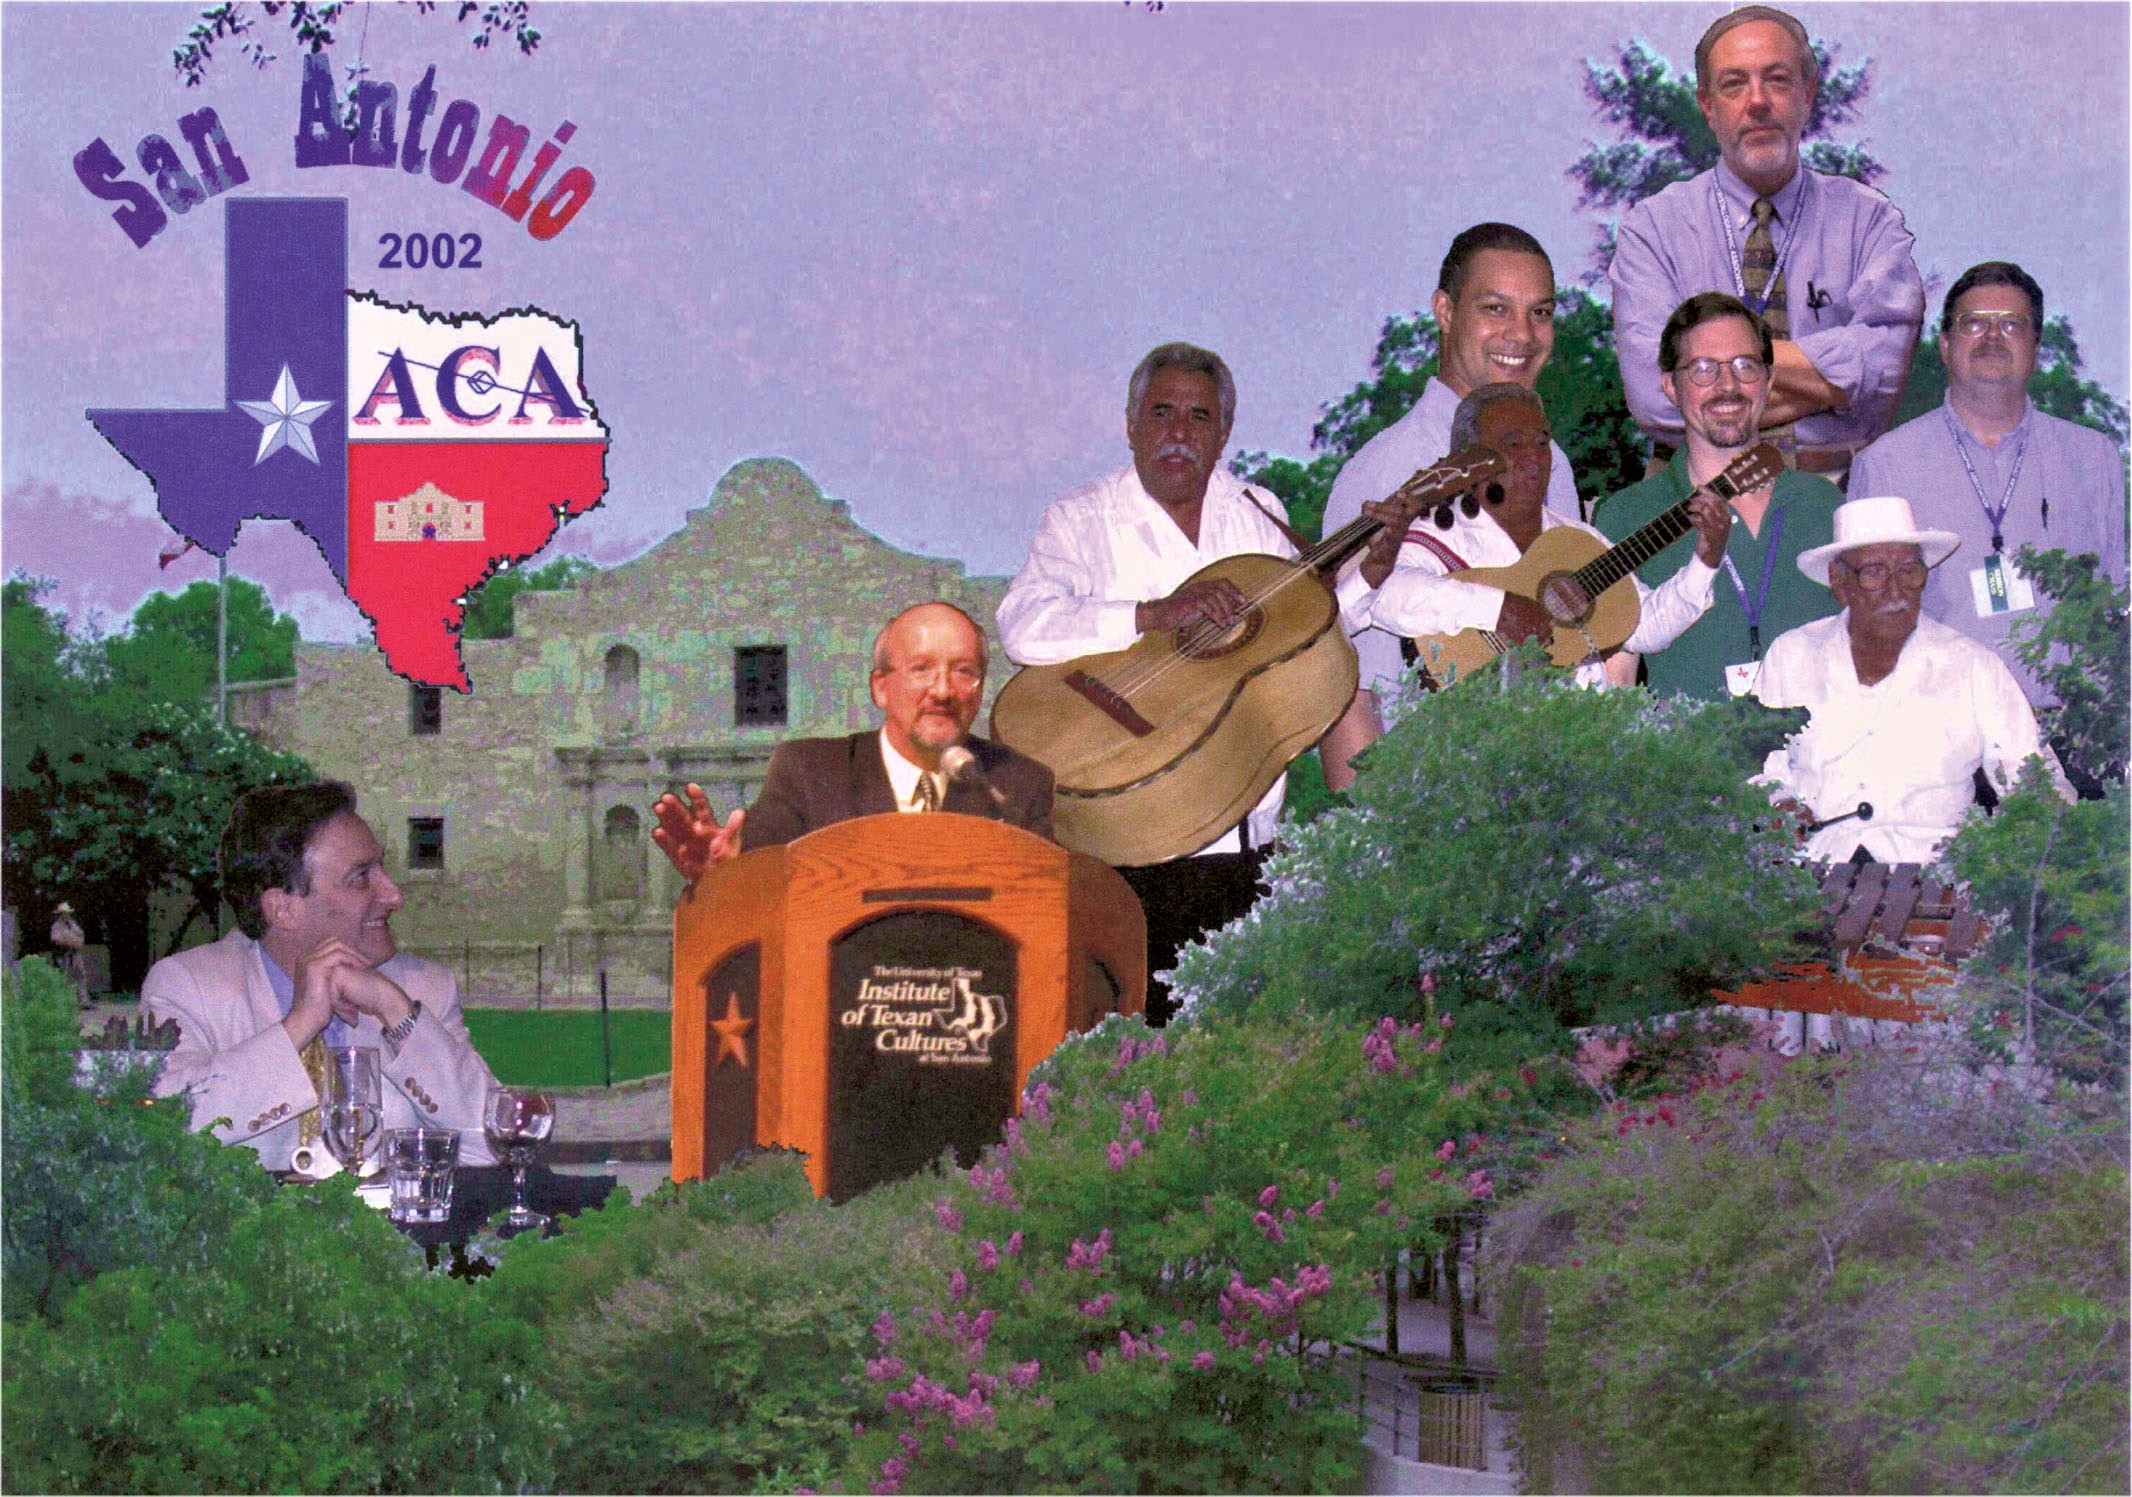
40 year reunion symposium attendees for Hackert and Robertus labs. Service to Crystallography: Of more direct interests to crystallography, I served as Secretary and later Chair of the BioMacromolecular Special Interest Group in the American Crystallographic Association (ACA); Chaired the ACA Publications Committee, was awarded an ACA Service Award in 1992, served on the US National Committee for Crystallography for over 22 years and Chair of the USNC/Cr from 1999-2002, elected as Vice-President of the then nearly 2,000 member ACA in 2006 and served as President in 2008, and have served on two local committees to host ACA meetings. The first was led by Stan Simonsen held on the UT campus in 1987 and the second was the 2002 ACA meeting in San Antonio that I served as co-local chair with Ray Davis. It bears mentioning that UT Austin has the distinction of having 3 faculty who have served as ACA Presidents – Hugo Steinfink (1995), Ray Davis (2002) and I (2008). I was honored to be selected as a Fellow of the American Crystallographic Association in 2020.
|
|
|
|
|
Chair of USNCCr – meeting in 2001 in DC meeting
with US National Science Adviser Jack Marburger.
|
|
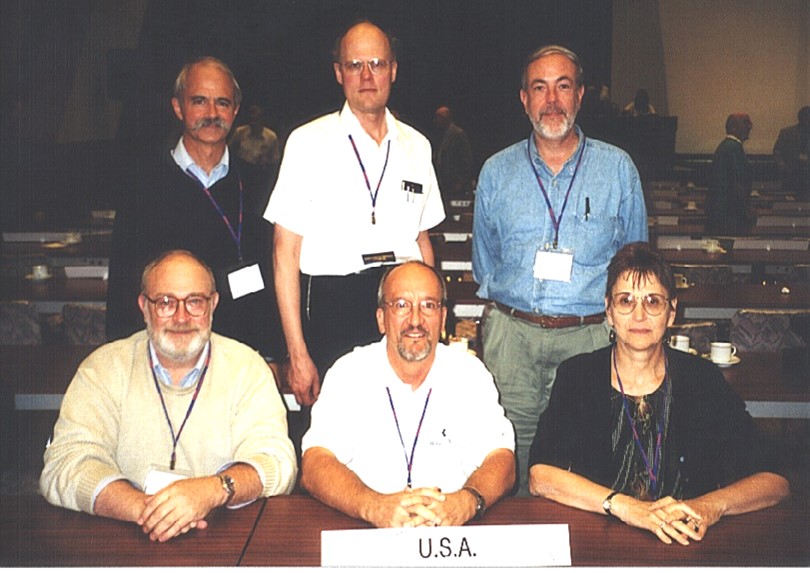
Chair of US delegation to IUCr GA in Geneva 2002, (f.r.)
Howard Einspahr, Marv Hackert, Judith Flippen-Anderson
(b.r) Bob Sweet, Jim Kaduk, William Stallings.
|
|
|
|
|
|
ACA banquet in San Antonio 2002; (l) Ira Flatow
(NPR Journalist & Etter Awardee), (c) Marv Hackert
(upper r.) ACA Past-President Bill Stallings.
|
|
ACA Presidents from UT – Ray Davis, Hugo Steinfink,
and Marv Hackert.
|
|
|
|
|
|
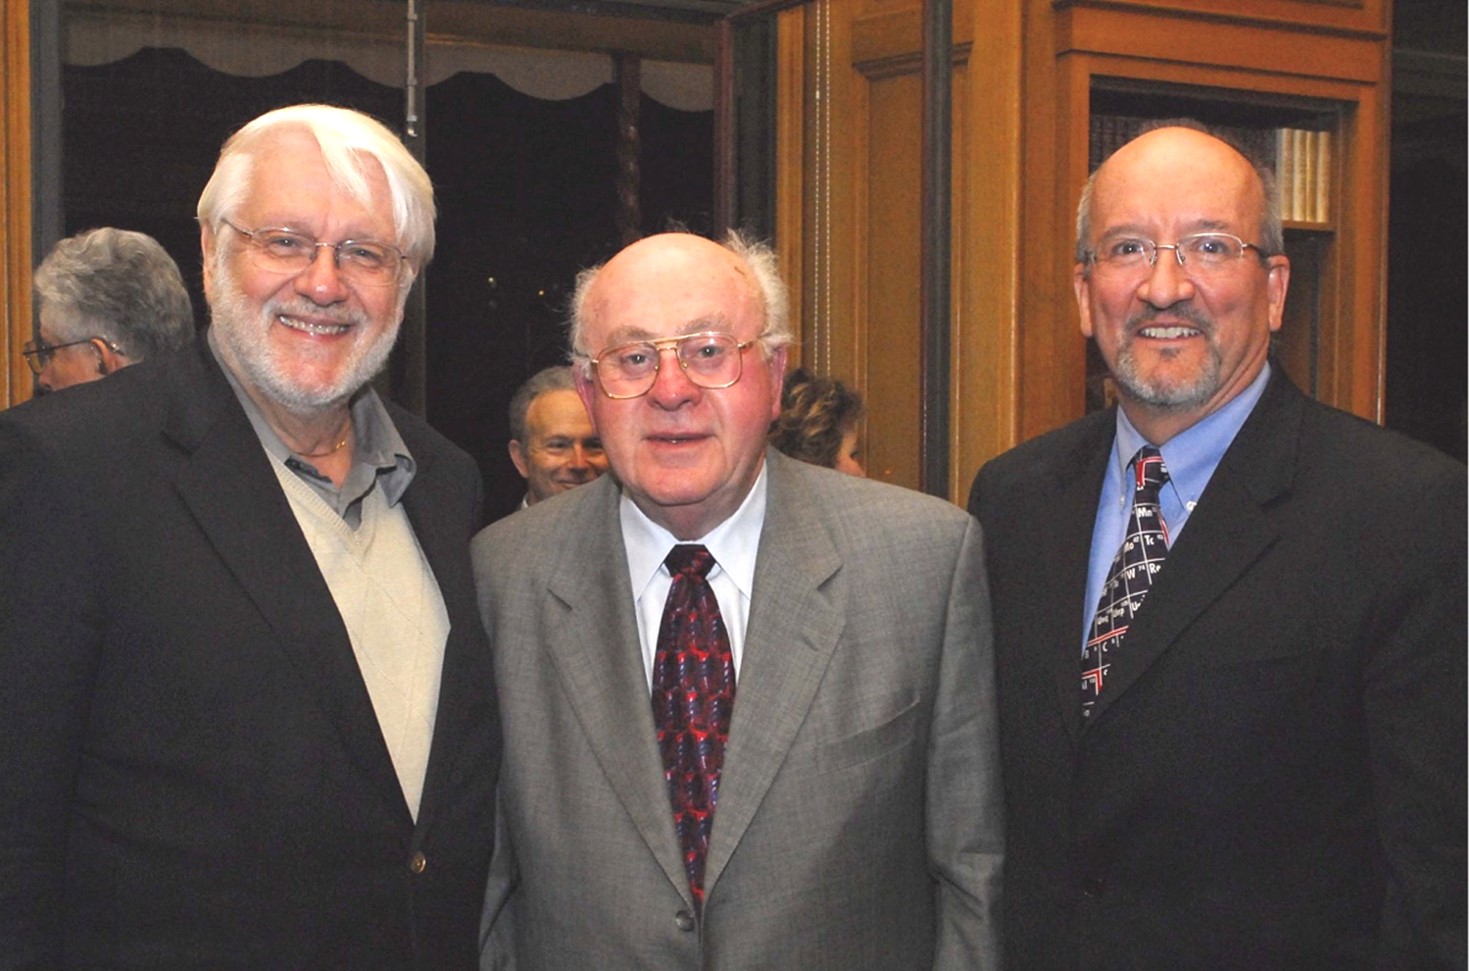
ACA Toronto after my banquet talk 2009 – Bretna & Marv
Hackert, Sine Larsen, Louis & Carol Delbaere.
|
|
ACA Denver 2016 – Always enjoy seeing UT alums
at ACA meetings.
|
 |
|
 |
|
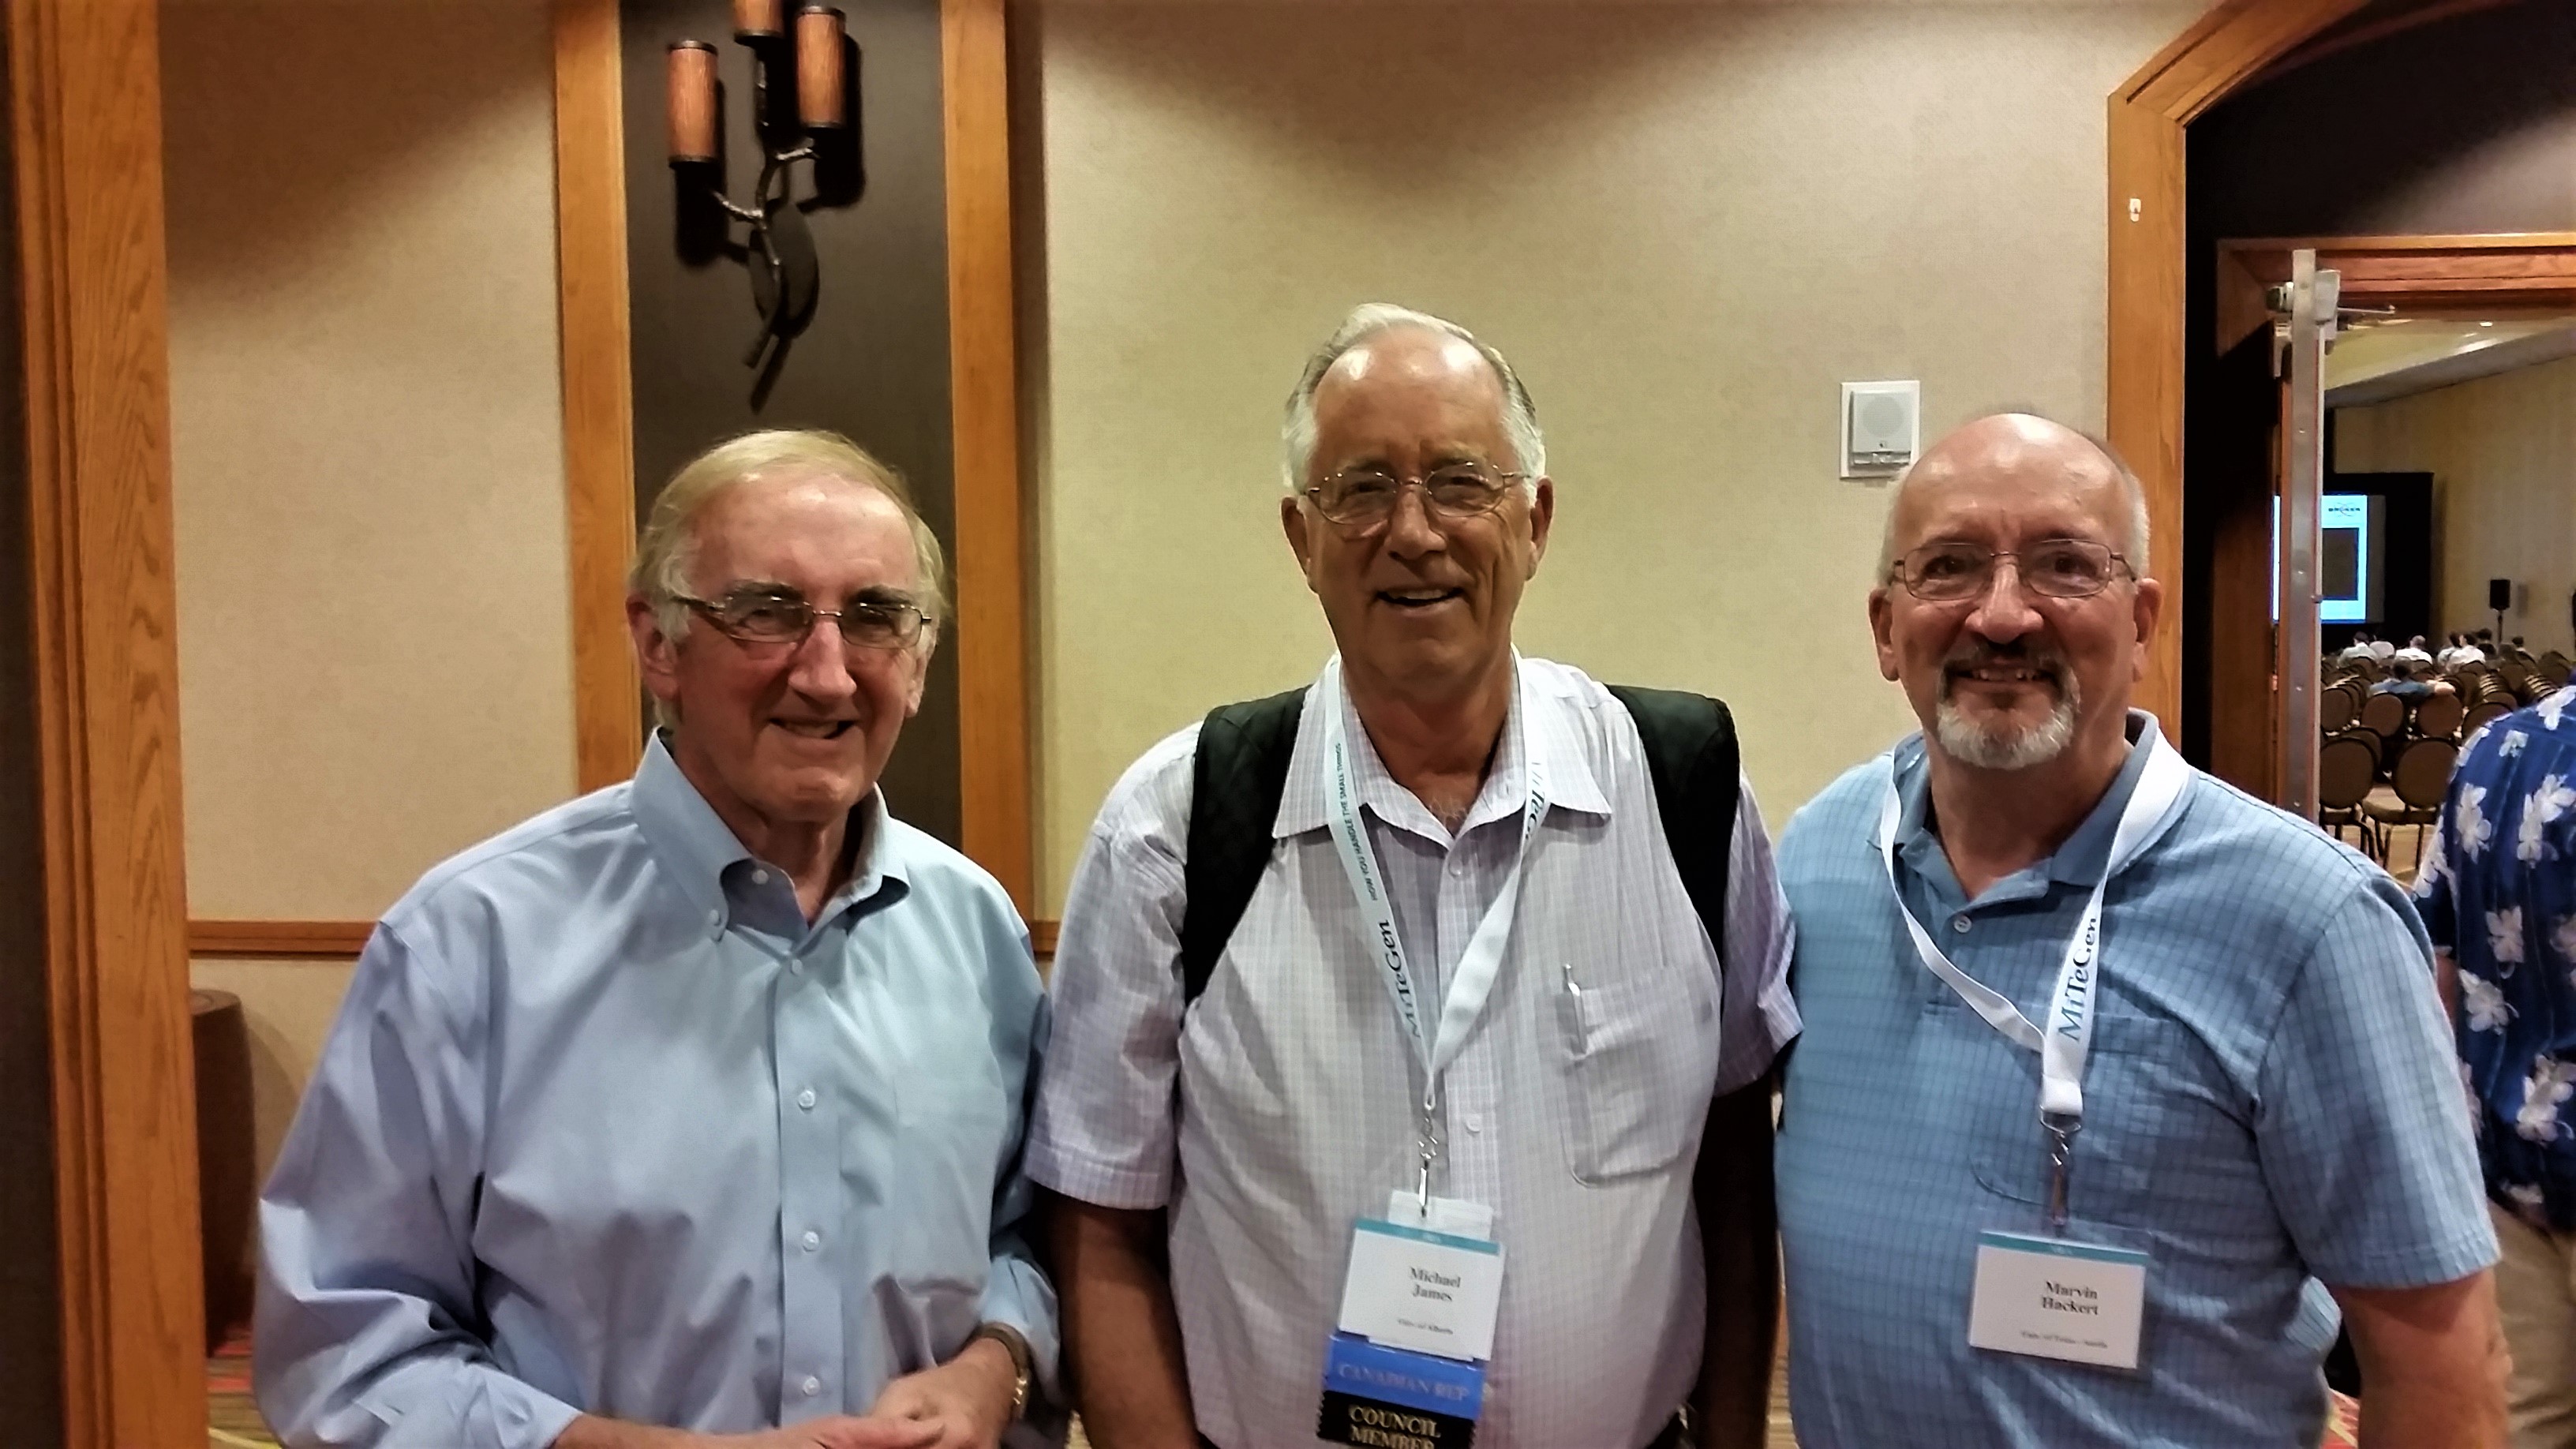
ACA Denver 2016 – Brian Matthews, Michael James
& Marv Hackert.
|
|
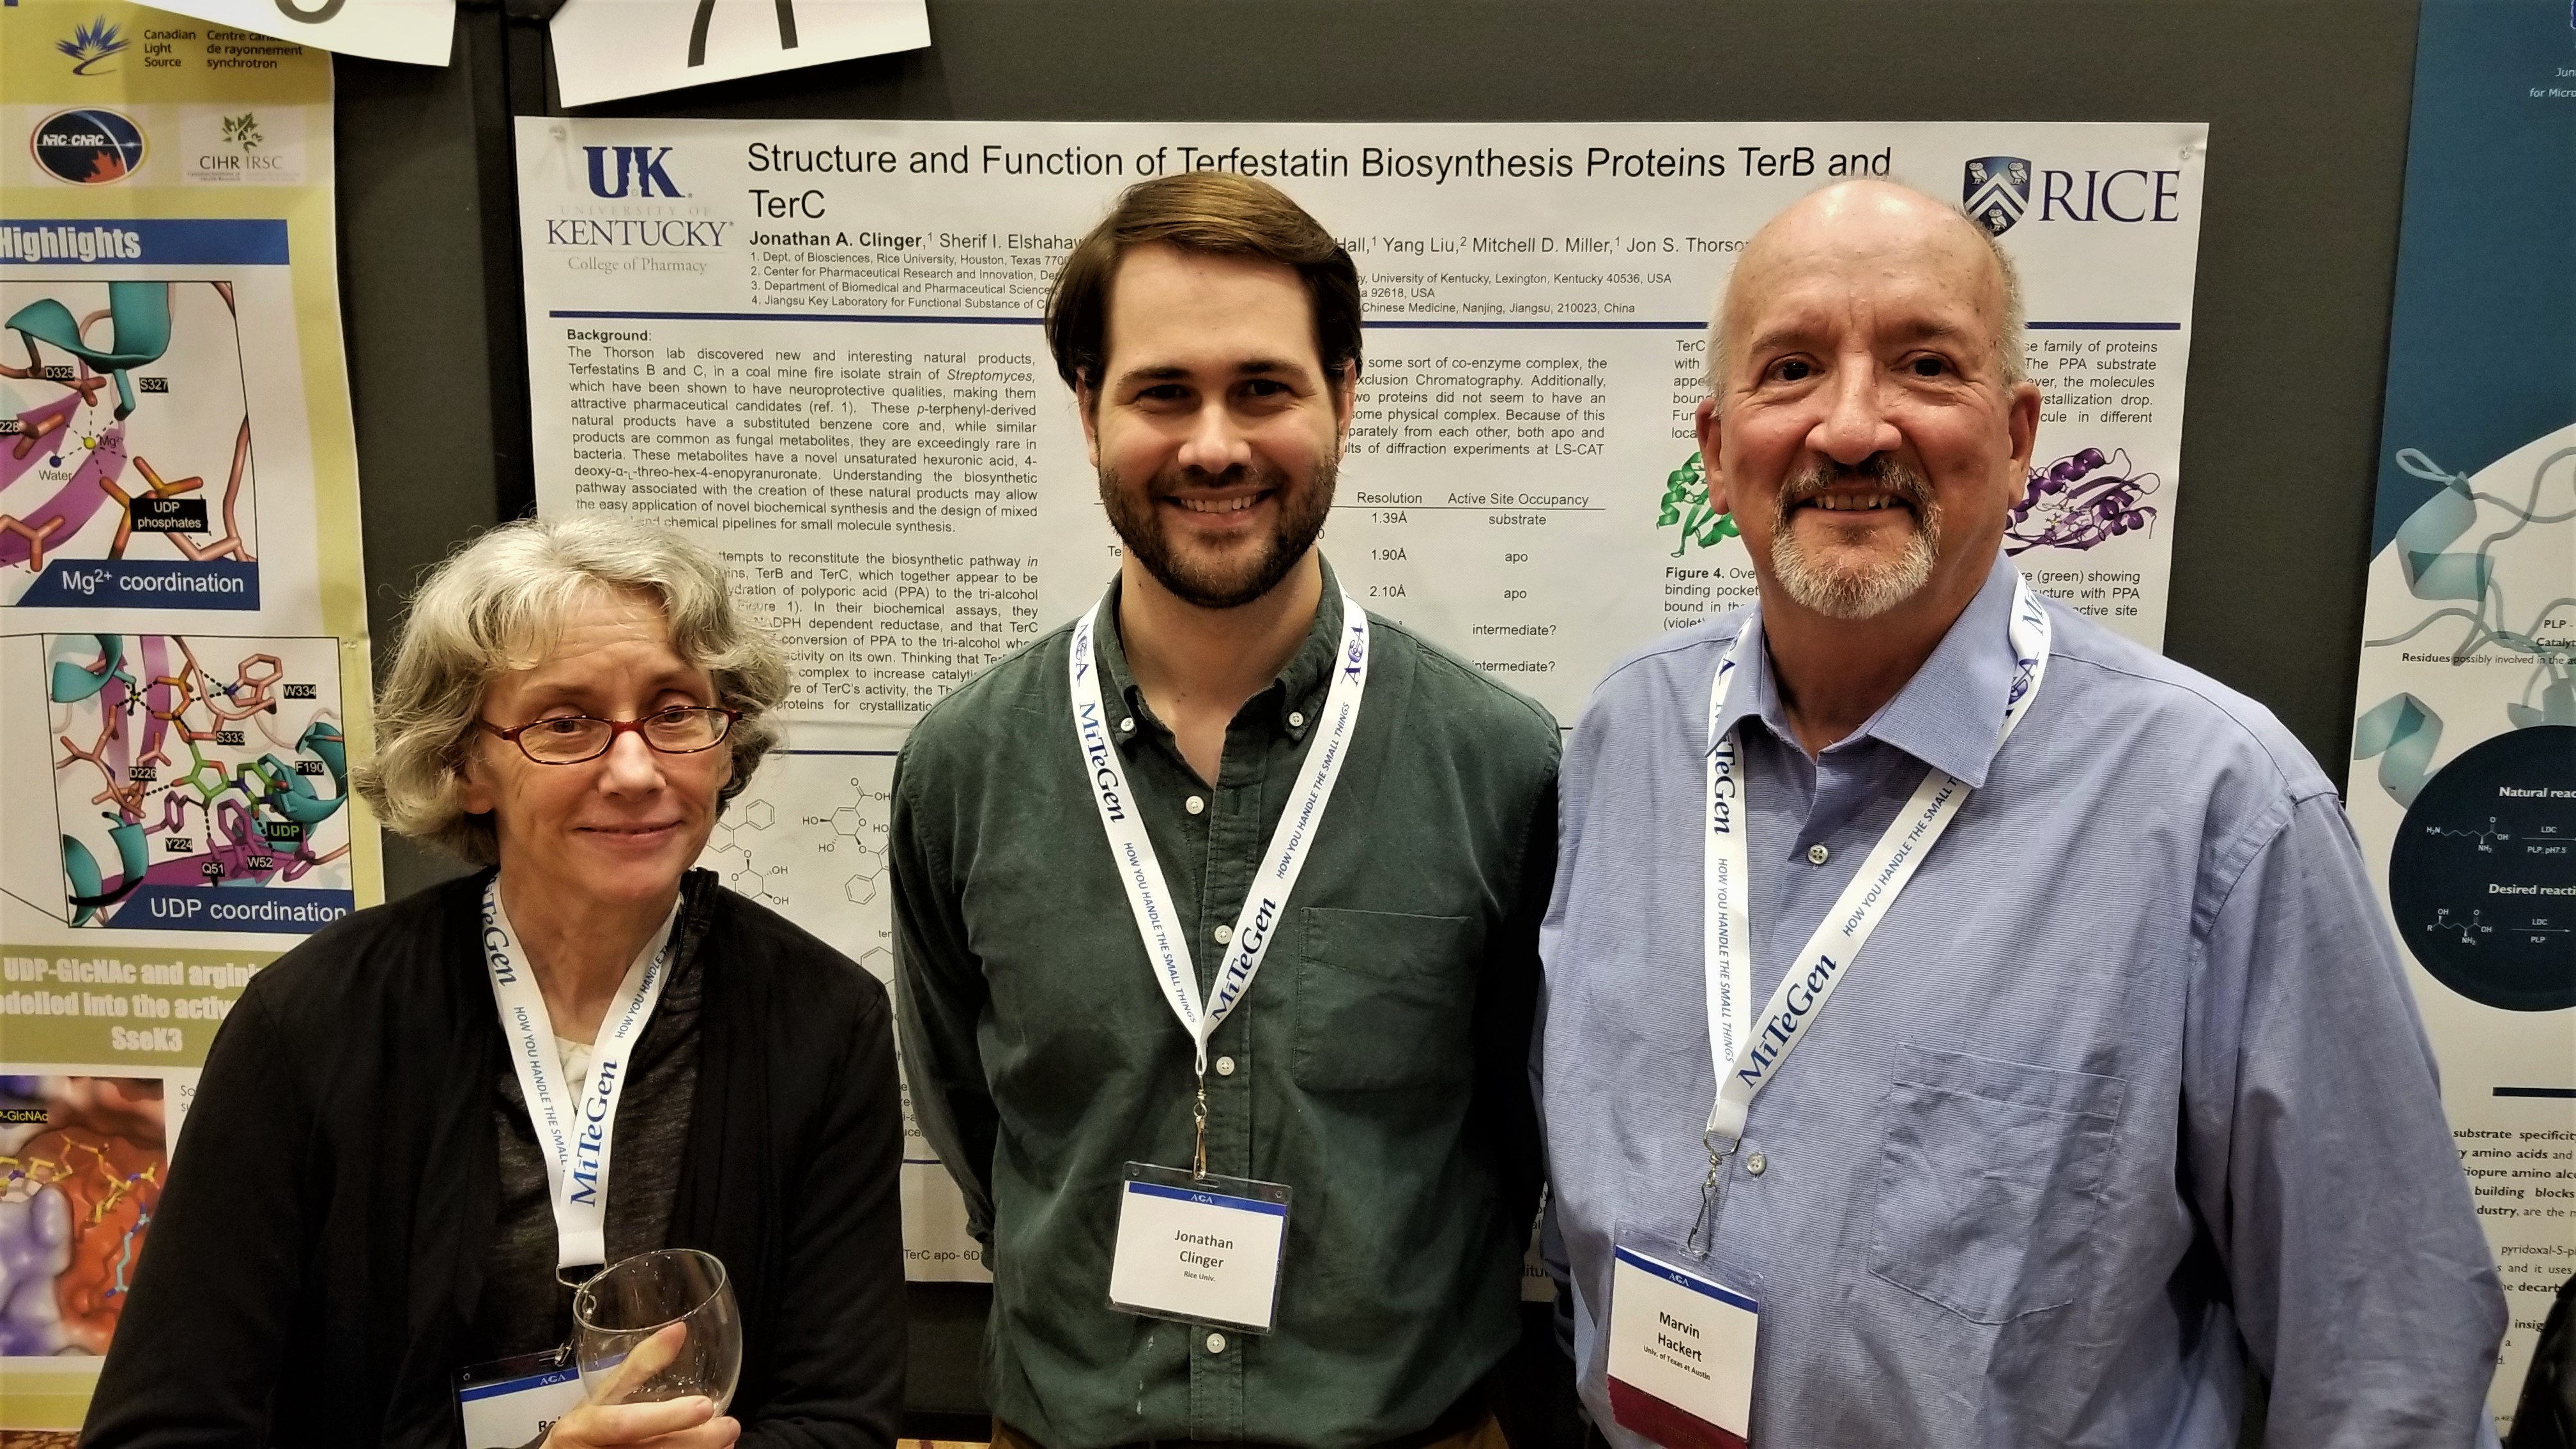
Three “generations” at ACA Toronto 2018 – Robyn Stanfield,
Jonathan Clinger (son of student Kent Clinger) & Marv Hackert.
|
More internationally, I have served on the Commission for Biomacromolecules of the International Union of Crystallography (IUCr), and have served on the IUCr Executive Committee and on the Board on International Scientific Organizations (BISO) of the NAS since 2010. I was greatly honored to be nominated and then elected as President of the IUCr in 2014, the year we celebrated the International Year of Crystallography (IYCr 2014). I currently serve as Immediate Past-President of the IUCr until my term expires at the end of the IUCr Congress in Prague in 2021.
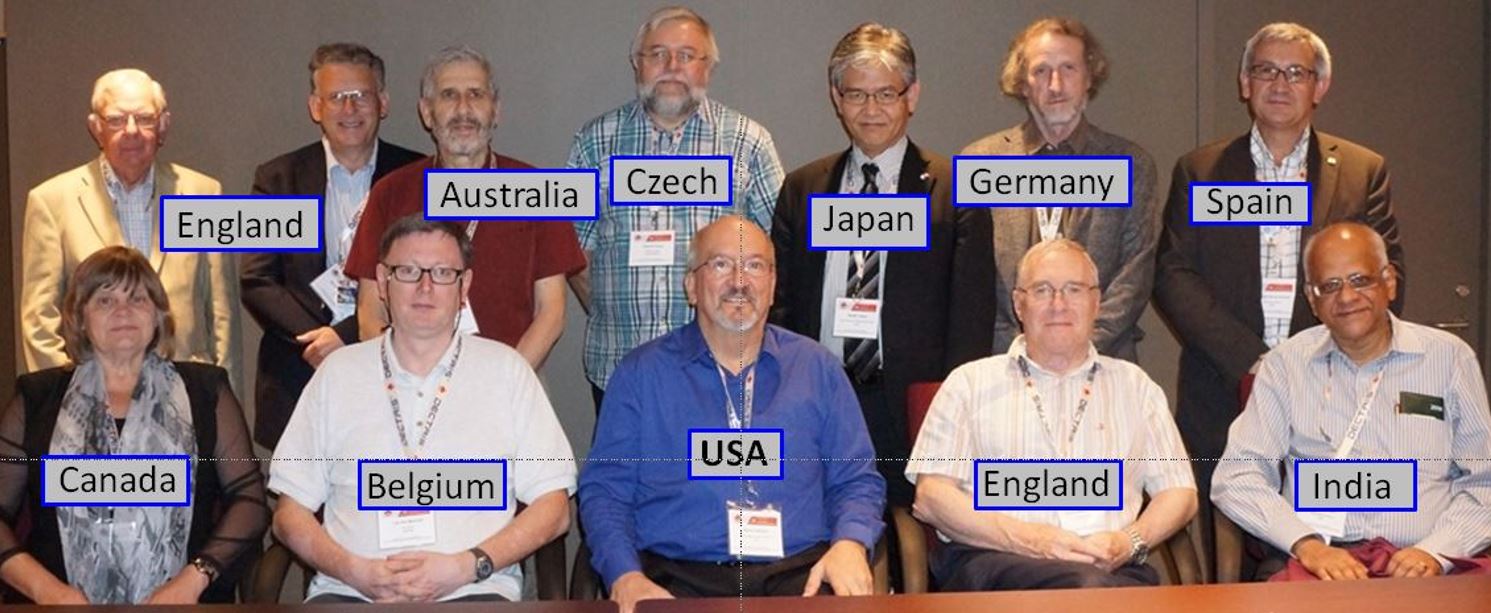
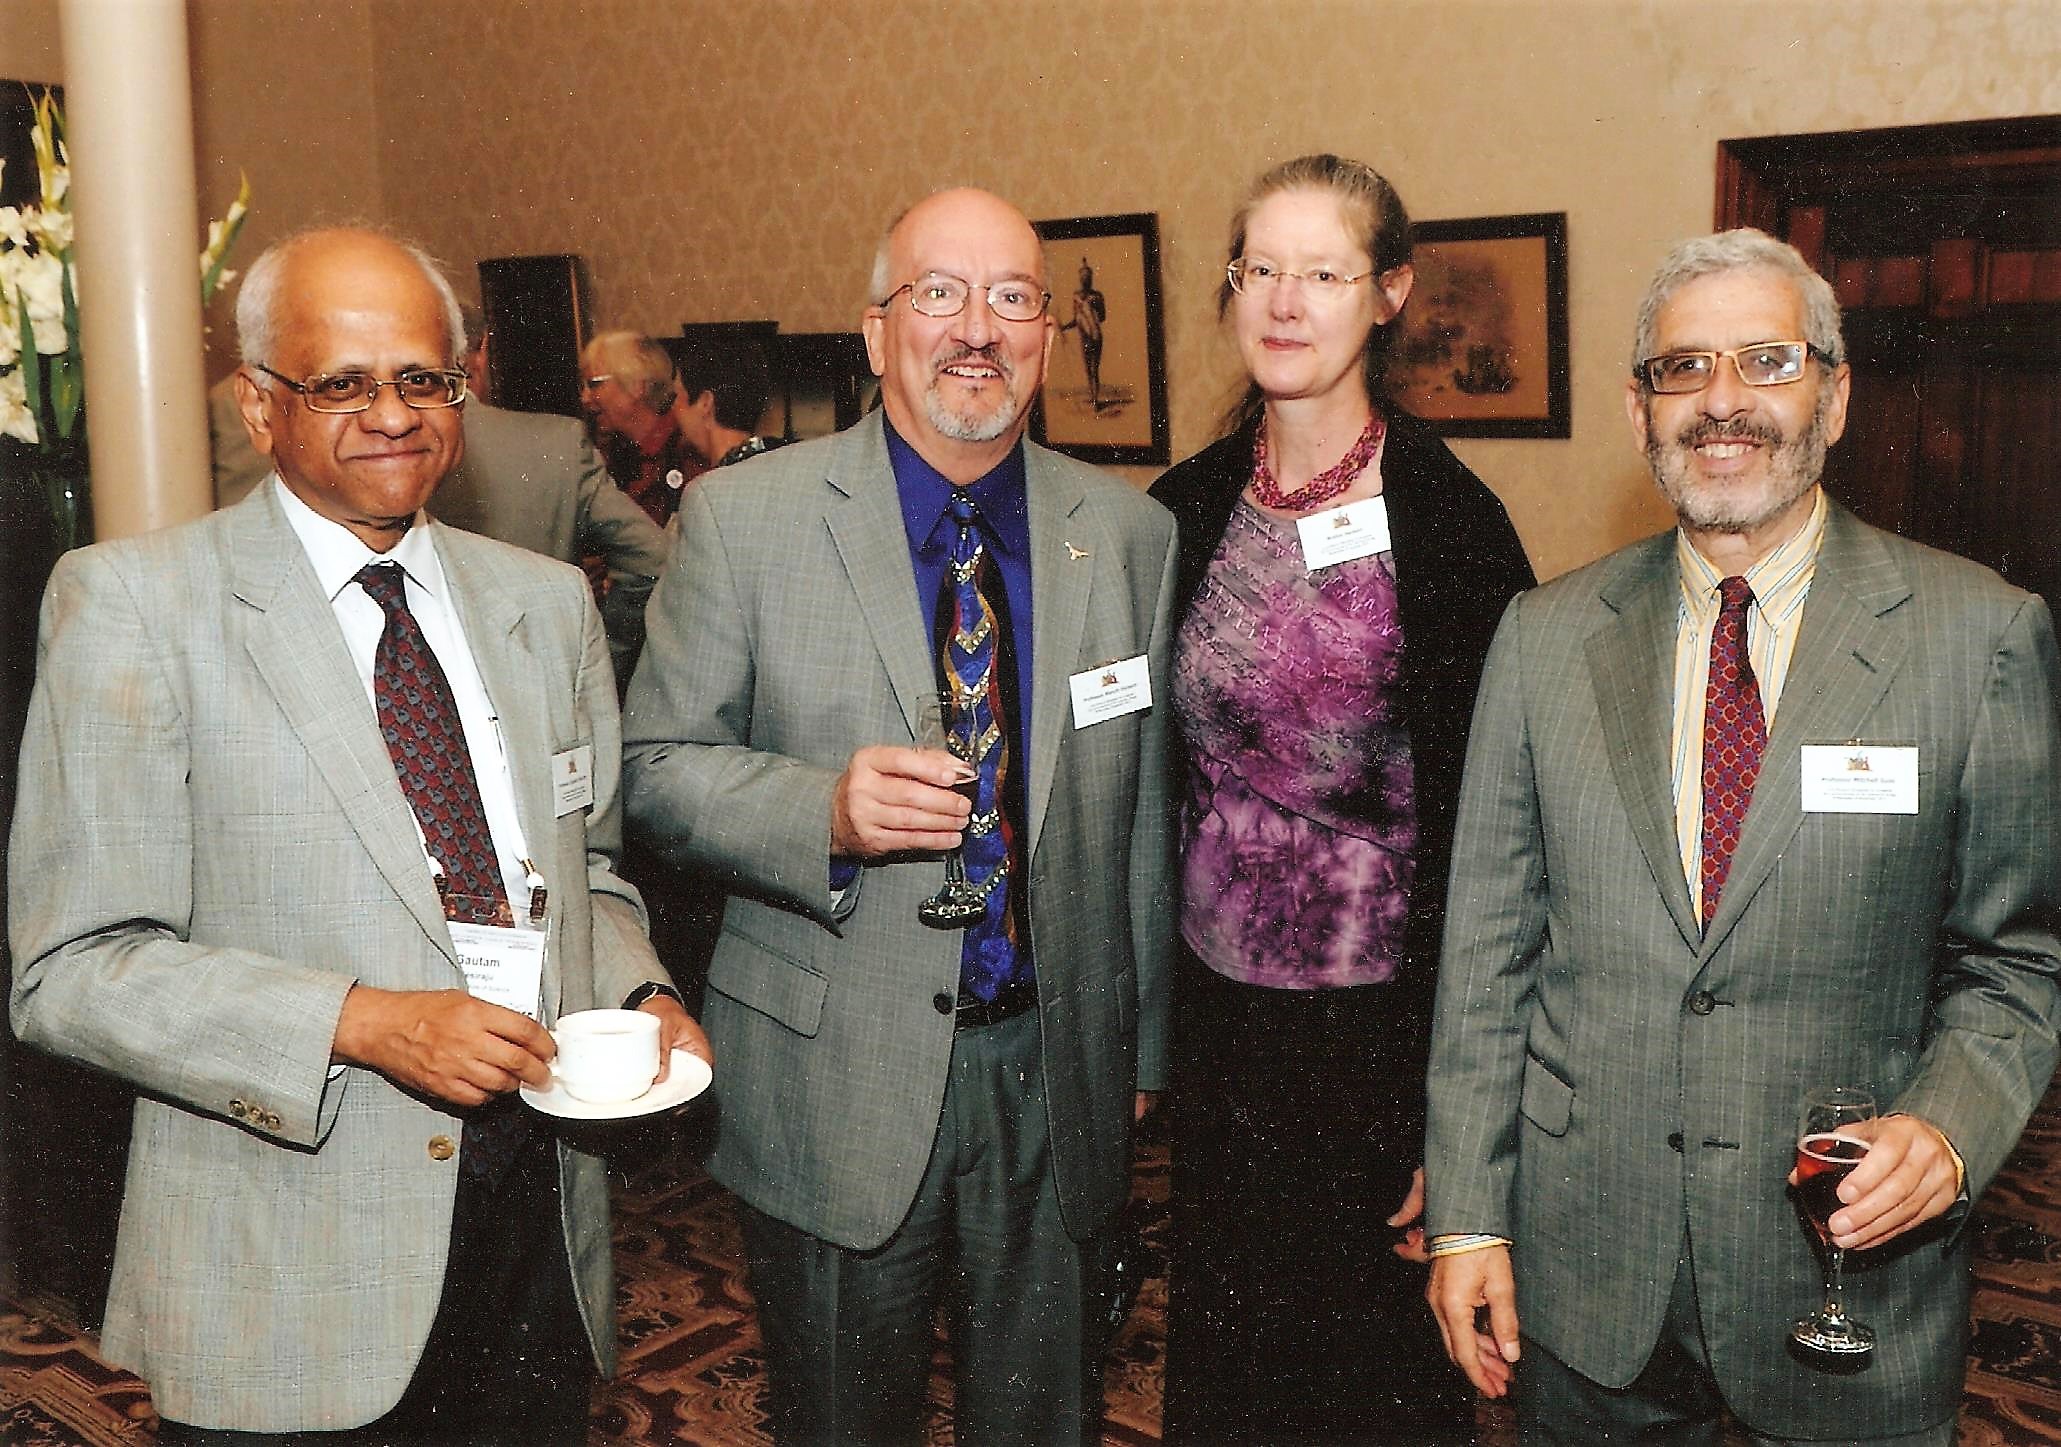
XXIII IUCr Congress and General Assembly in 2014.
Front Row: Hanna Dabkowska , Luc Van Meervelt (Sec./Teas.), Marvin Hackert (President),
Mike Glazer (Vice-Pres.), and Gautam Desiraju (Past-Pres.);
Back Row: Malcolm Cooper (Fin. Comm.), Michael Dacombe (Exec. Sec.), Mitchell Guss, Radomir Kuzel,
Masaki Takata, Wulf Depmeier, and Santiago Garcia-Granda.
My time on the IUCr EC has been both rewarding and challenging. The IUCr is a complex organization. In addition to organizing international conferences, it is a publishing union – publishing 9 major journals from Acta A to IUCrJ, and is heavily involved in outreach to support the development of crystallography in many regions of the world. The major challenges that the IUCr EC has had to address were related to the changing landscape that has taken place in the publishing world and how that relates to IUCr funding to meet both the needs of the journals and staff in Chester, but also having funds to support good works and young crystallographers around the world. During my time on the IUCr EC we had to adjust to Open Access publishing, convert to on-line versions of our journals, recruit a new Editor-in-Chief for the journals (twice), and identify a replacement for long-time IUCr executive secretary Mike Dacombe. We also took major steps to address diversity and ways to insure better representation on the IUCr EC and on its Commissions. I was part of a sub-committee that proposed amendments to IUCr Statutes and By-Laws that called for guaranteed regional representation on the IUCr EC. In Madrid at IUCr XXII in 2011 the General Assembly approved a change that the election of Officers of the Union shall be arranged in such a way that there will not be more than two Officers from any one Country and that amongst the six ordinary members on the EC there will be at least one Officer from a Country from each of the three geographical regions (i) Europe and Africa, (ii) the Americas and (iii) Asia/Oceania. In Hyderabad at IUCr XXIV in 2017 the General Assembly approved a statement supporting gender equity and the importance of diversity (including age and geographical representation) in all IUCr activities such as IUCr officers, members of Commissions, invited speakers, etc. This has led to the creation of a Gender Equity and Diversity Committee (GEDC) and the adoption of an IUCr GEDC Code of Conduct. In brief, it reaffirms that the IUCr represents crystallographers worldwide and is committed to achieving gender equity and diversity that mirrors our crystallography community in all its activities and seeks to remove obstacles to professional growth and advancement for minorities within our communities.
Early on during my time on the EC, IUCr cash flow was very positive and our community got accustomed to having the IUCr be able to help fund a large number of schools, conferences, etc. IUCr expenditures for good works grew rapidly without having budget restraints in place. As activities and expenditures associated with the IYCr ramped up, this resulted in major deficits for several years that tapped into reserves. One of my goals as President of the IUCr was to help enact cost saving measures and structure budgets to insure that we covered our essential publishing activities and the IUCr Congress, and support other conferences and outreach to the extent our funds and fund raising allowed. A special thanks to the IUCr Finance Committee for providing guidance on steps to help bring the IUCr finances back into balance.
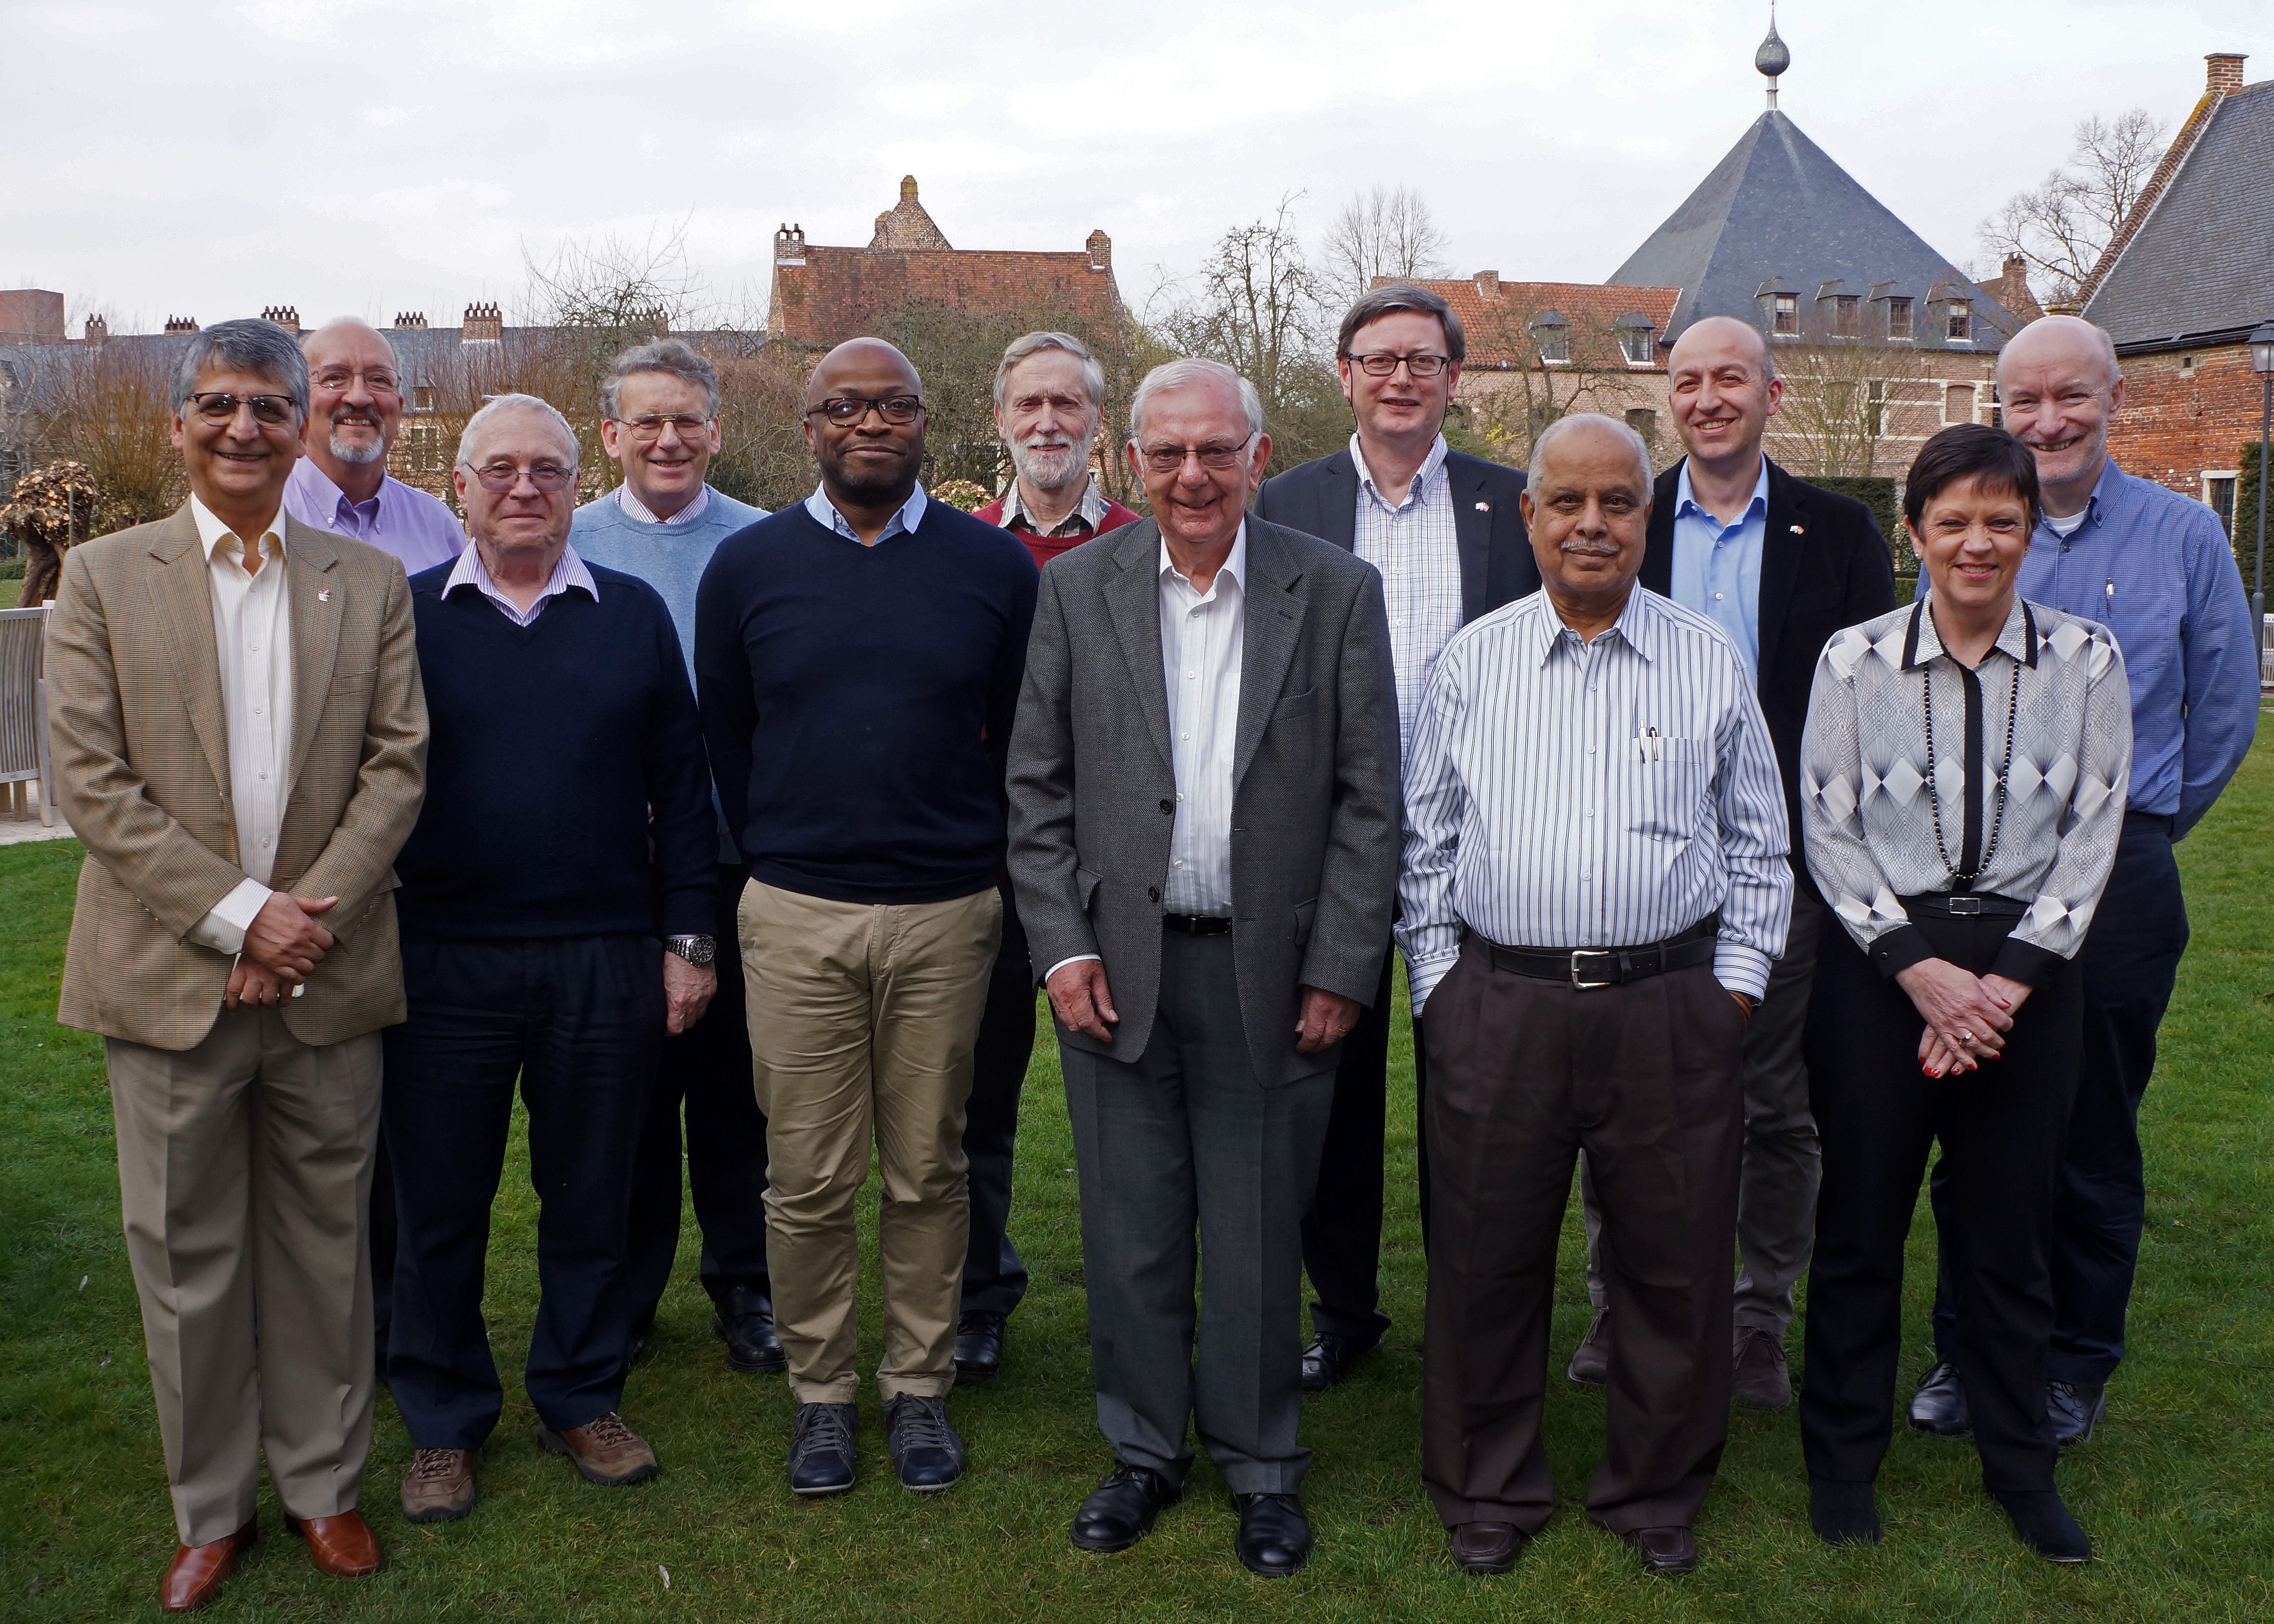
IUCr Finance Committee meeting in Leuven - (l. to r.) Samar Hasnain, Marv Hackert, Mike Glazer, Michael Dacombe,
Jonathan Agbenyega, Chris Gilmore, Malcolm Cooper, Luc Van Meervelt, Narasinga Rao,
Michele Zema, Jane Robinson and Peter Strickland.
One Finance Committee meeting in Leuven deserves special mention. On the morning of March 22, 2016 we were on track to finish our meeting by noon. People had their bags packed, many had already checked out of their room and were discussing plans after lunch to go the airport, or in my case the train station. However, about 8:00 a.m. two suicide bombers, carrying explosives in large suitcases, attacked a departure hall at Brussels Airport at Zaventum. Just over an hour later, a further blast happened at the Maelbeek metro station in Brussels city center. In total 32 people were killed in addition to the 3 suicide bombers, and another 340 were injured in the attacks. The airport shut down as were the trains shortly thereafter – there was no air nor rail transportation available in Belgium – thousands of would-be passengers were now stranded in the Brussels area. Hotel rooms we had vacated hours earlier were already booked, car rentals were scarce, etc. However, we learned that trains were still running in France and Mike Glazer, Rao and myself wanted to get to London. Luc Van Meervelt kindly offered to drive the three of us to Kortrijk on the other side of Brussels and the closest railway station still operating across the French border where we could get a train to Lille. France. In Lille we were part of a very long line of hopeful standby passengers wanting tickets for a Eurostar coming out of Paris on its way to London. We were grateful to have gotten seats in an unreserved compartment, it was crowded and everyone was nervous. However, what I remember most about the trip was the three of us sitting in one seat and across from us was a young girl and her mother. Somehow we got onto the subject of us being crystallographers and we spent much of the rest of the journey tutoring them on what crystallography is and its benefits to society. Mike Glazer was in his prime – well-rehearsed from having shared this material many times before as part of IYCr 2014 celebrations.
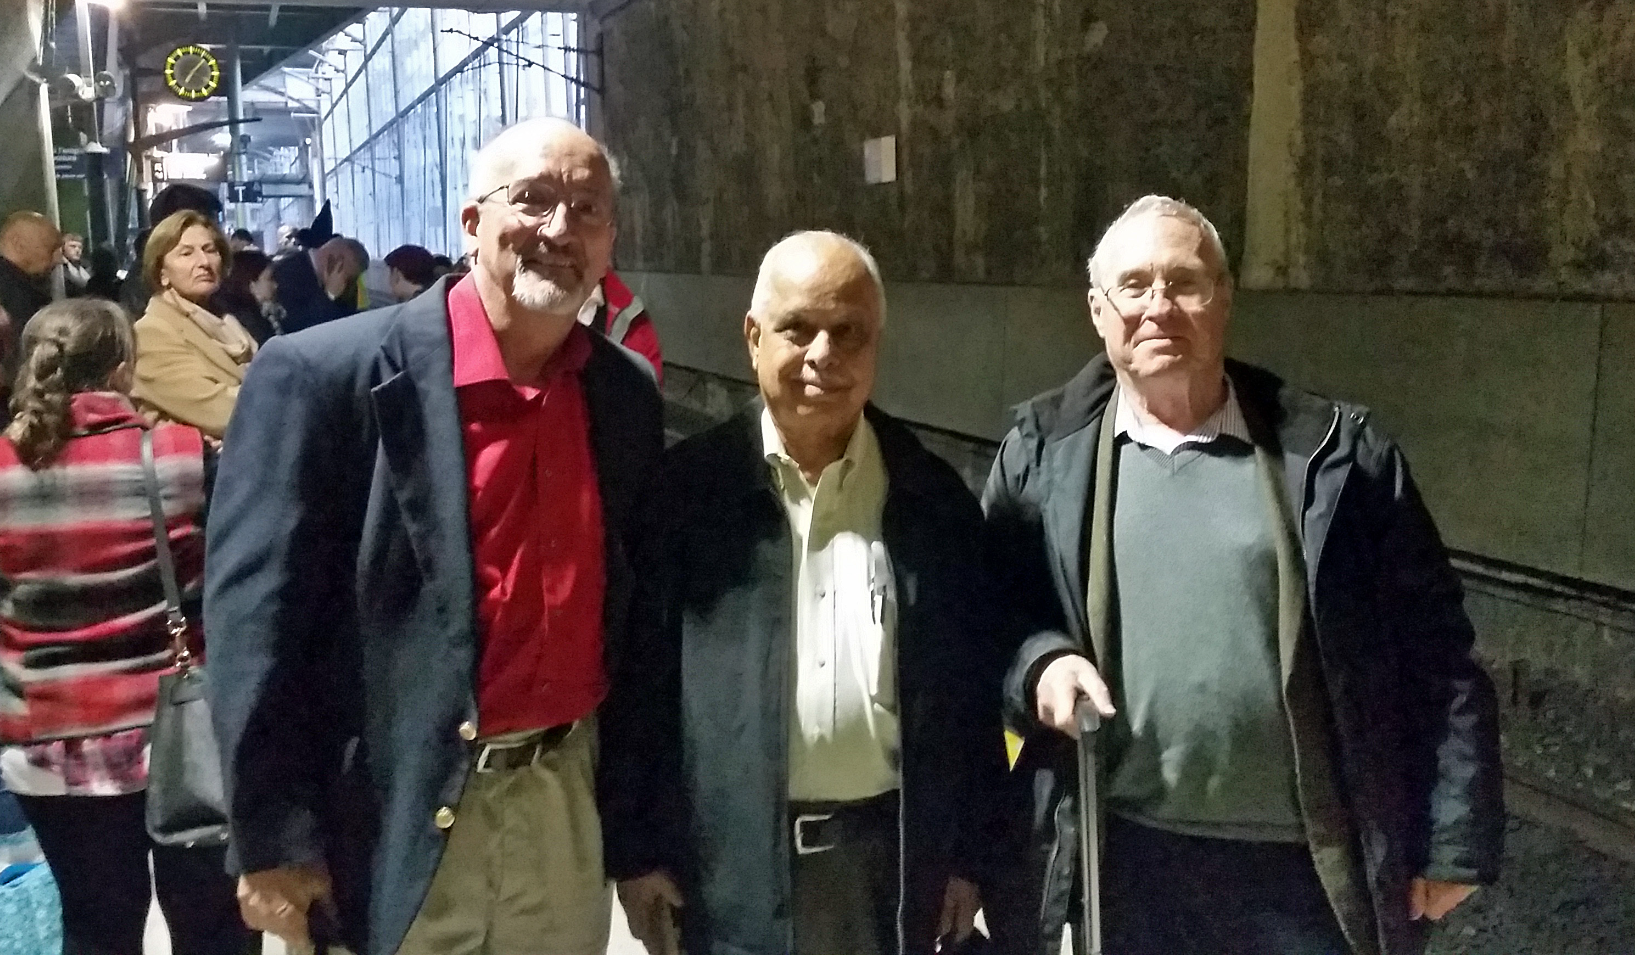
Marv Hackert, Narasinga Rao and Mike Glazer in Lille, France;
grateful to soon board a Eurostar to London the day of the airport bombings in Brussels.
Probably the most rewarding event during the past decade on the IUCr EC was when the United Nations declared 2014 as the International Year of Crystallography, and the variety of events that flowed from that as we celebrated and promoted the benefits of crystallography to society around the world. The unofficial kick-off for our celebrations was the Bragg Symposium in Adelaide, Australia in 2012 (we originally hoped to have IYCr 2013 to coincide with the 100 year anniversary of when the two Braggs determined the first crystal structures). In Adelaide it was great to see where William Henry and William Lawrence Bragg did their early pioneering work and to have dinner in the Bragg home. I have many other fond memories of events I was able to participate in around the world. One of the major efforts during this time was to work to further the developments of crystallography in South America and Africa. The creation of LACA (Latin American Crystallographic Association) as a fourth Regional Associate of the IUCr and the work being done to promote crystallography in Africa are two of the lasting legacies of these efforts.
 |
|
 |
|
Bragg Symposium / Adelaide (2012) (l. to. r) Gautam Desiraju, Marv & Bretna Hackert, Mitchell Guss.
|
|
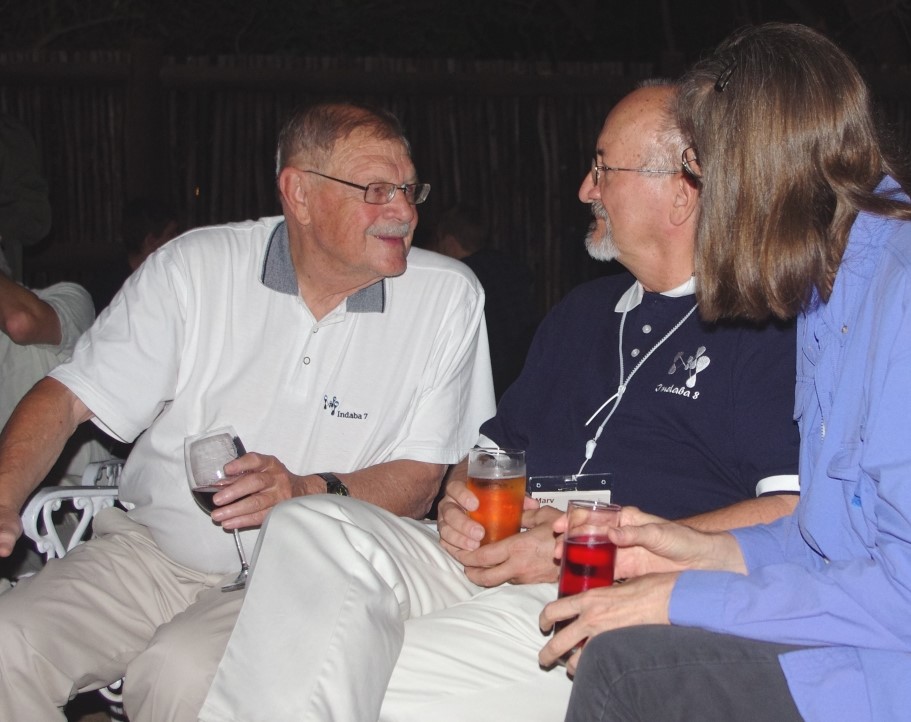
Indaba 8 (2015) - Celebrating Crystallography in
Africa with Jen Boeyens.
|
|
|
|
|
|
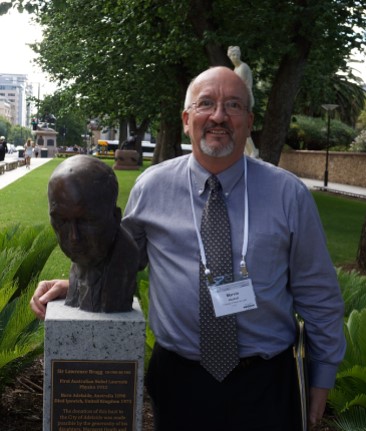
Adelaide, Australia - Bragg Symposium (2012) Marv Hackert with bust of W. L. Bragg.
|
|
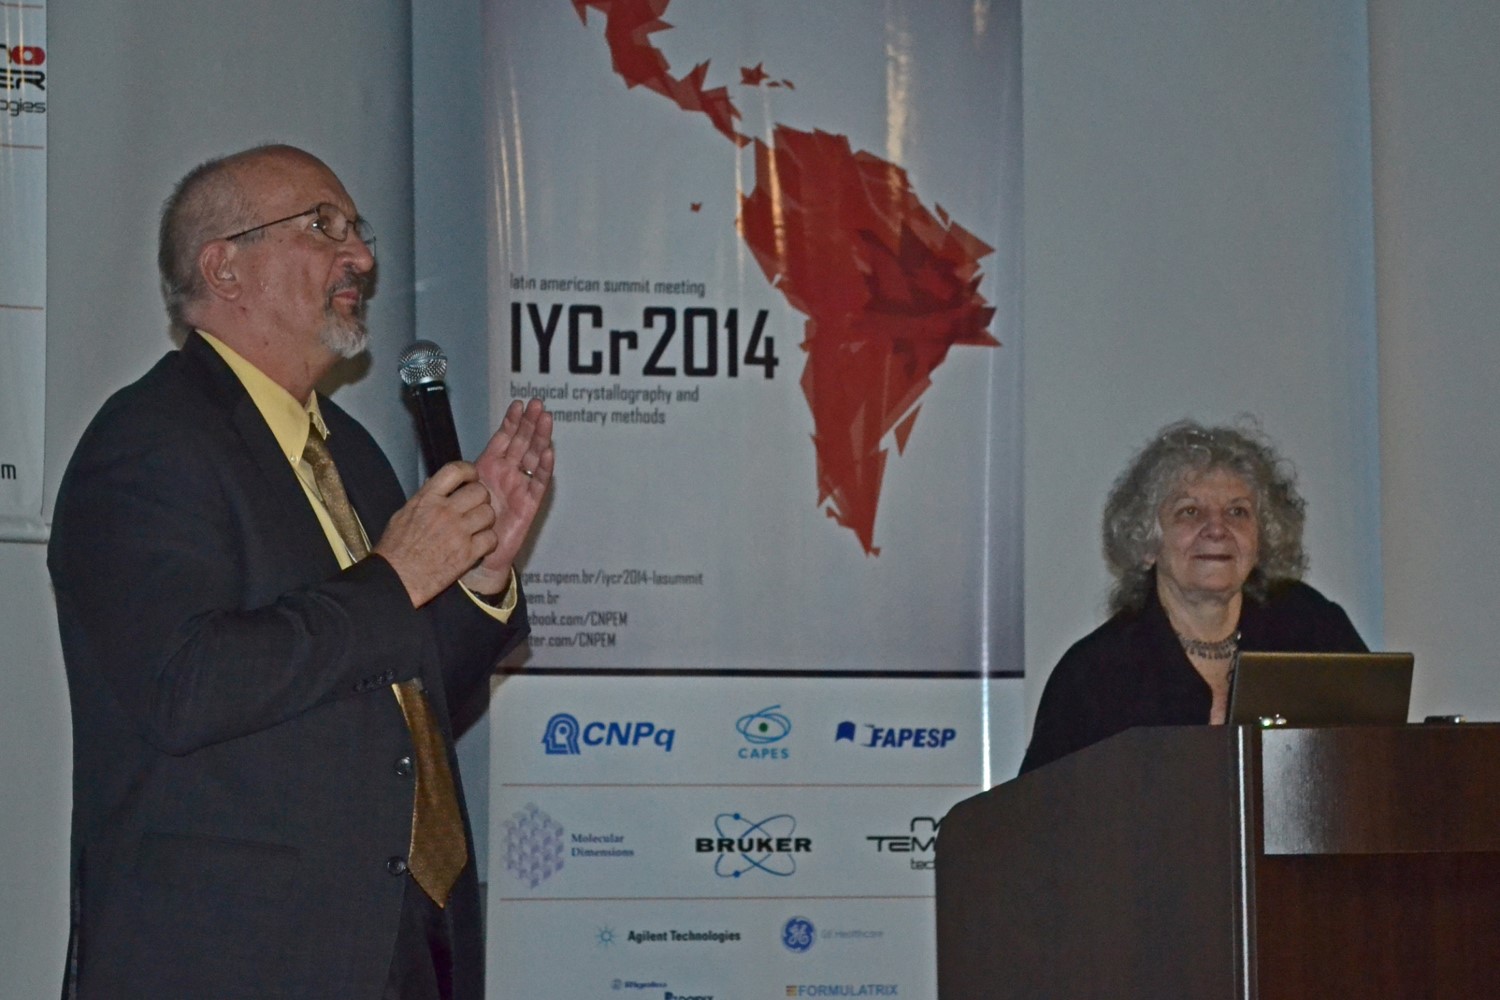
Latin American Summit 2012 (Campinas, Brazil) with Ada Yonath
|
 |
|
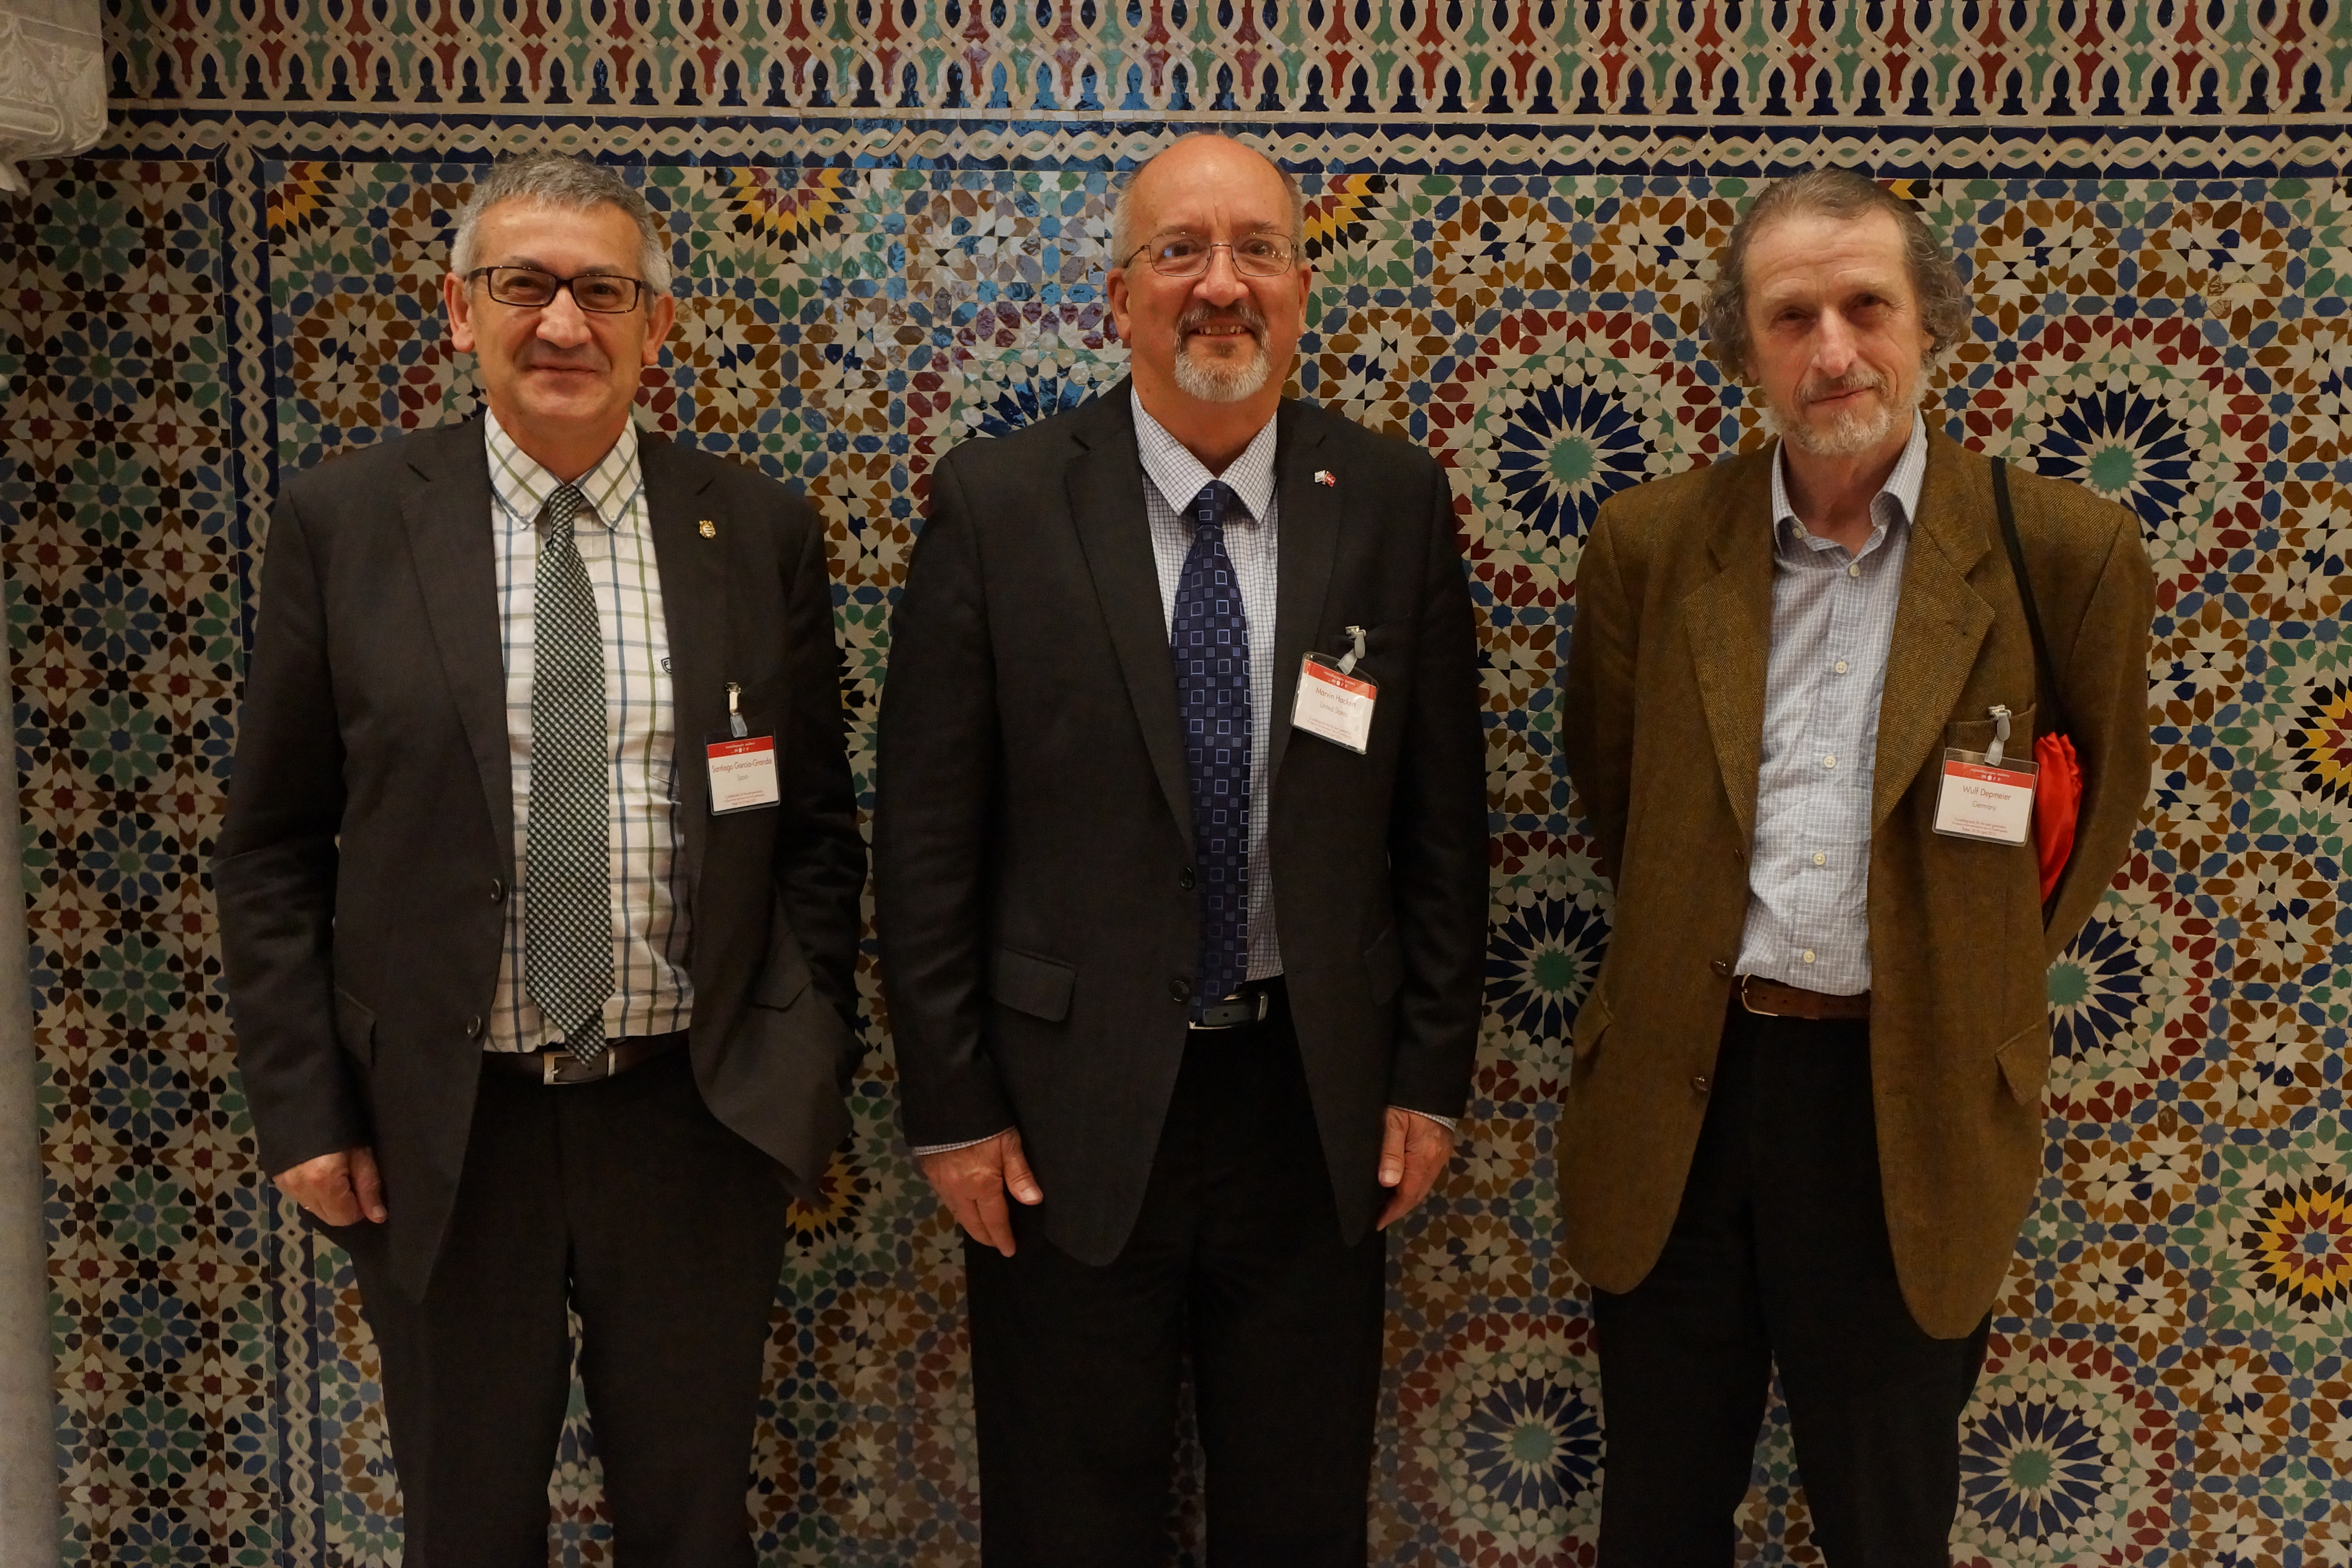 |
| IYCr 2014 Closing Ceremonies – Rabat 2015. |
|
IYCr 2014 Closing Ceremonies – Rabat 2015 Santiago Garcia-Granda, Marv Hackert, Wulf Depmeier.
|
 |
|
|
|
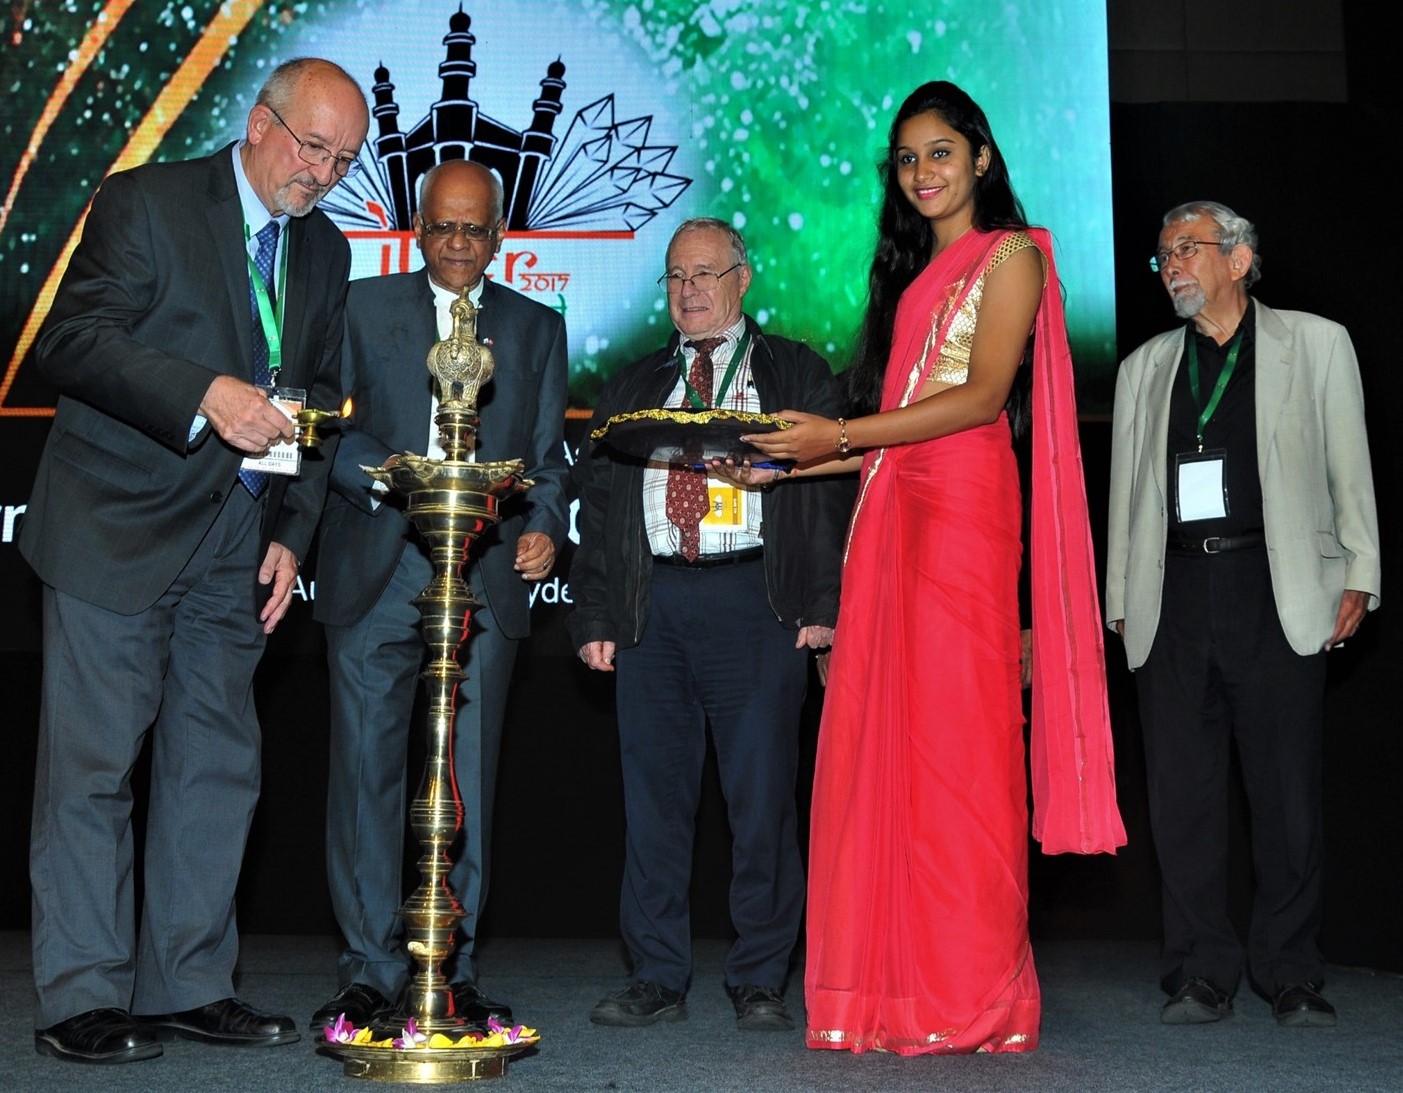
IUCr Closing Ceremony – Hyderabad 2017
M. Hackert, G. Desiraju, M. Glazer, T. Blundell.
|
|
|
The 2nd Meeting of the Latin American Crystallographic Association (LACA) in Mérida, Yucatán, México, 22–27 October 2016.
Conclusion: Technological advances continue to impact our field of “crystallography”. PC workstations and laptop computers are powerful, cheap and common. The problem of rapid radiation decay in bright beams was partially addressed by flash-freezing the protein crystals. Robotics enabled remote data collection and reduced the drudgery involved setting up crystallization plates. Synchrotron sources like the APS (Advanced Photon Source) were built with beam lines specifically designed for macromolecular structure needs in mind, upping the brightness of the source by additional orders of magnitude to the point where the beam had to be attenuated to not exceed the read out speed of the area detectors. This led to the development of fast continuous read-out detectors such as the large, multi-array CCD detectors used at many synchrotrons, enabling entire data sets to be collected in minutes or seconds, or less! Additional brightness has been made possible with Free Electron Laser X-ray sources, making it possible to obtain data from crystals only a few µm in size. Although the crystal is destroyed by the beam within a few femtoseconds, a “still” image of the randomly orientated crystal can be obtained before the crystal is destroyed, and modern computers have the ability to reconstruct the full reflection data set from many of these random images.
As these advances have expanded our tool set to study and determine structural information, it is now possible to do “crystallography” without crystals. That has caused some confusion and led some to state that “crystallography” is now just a tool and no longer a science. In an editorial in IUCrJ (April 2020), Ted Baker noted that the term “crystallography” has come to “embrace a range of approaches, from traditional single-crystal X-ray analysis through electron and neutron diffraction to cryo-electron microscopy (cryo-EM) and a variety of scattering technologies. Some are relatively mature, while others such as cryo-EM are undergoing revolutionary change. Collectively, they provide a uniquely powerful atomic scale view into the natural world, and when used judiciously, often in combination, can enable the three-dimensional structures of extremely complex molecules and molecular assemblies to be determined with sometimes breathtaking speed.”
As I wrote this article the world is dealing with a global pandemic crisis caused by the SARS-CoV-2 coronavirus. By Thanksgiving 2020, this virus had already infected over 62 million people worldwide and was responsible for nearly 1.5 million deaths. In the United States, there were over 13 M cases and over 250,000 deaths, and the numbers were still rising rapidly! It is gratifying to see scientists around the world cooperating on several fronts to address this deadly disease, to understand how it spreads, to find and develop vaccines, antibodies and drugs to treat COVID-19.
Our crystallographic community played a major role in this effort. I will close this 50+ year look at my view of changes in our field with one example of a young colleague of mine, Jason McLellan, in our Department of Molecular Biosciences at The University of Texas at Austin. Jason and his colleagues used cryo-electron microscopy to determine the structure of the large spike protein on the surface of the coronavirus. Just two weeks after the genome sequence of the virus was shared by Chinese researchers, his team had designed and produced a stabilized version of the spike protein. In just 12 more days they had reconstructed the 3D atomic scale map of the spike protein, AND submitted a manuscript to Science. The spike protein is that part of the SARS-CoV-2 virus structure that attaches to and infects human cells. Determining this structure was an important step for researchers around the world to develop vaccines and antiviral drugs to combat the virus. I was pleased when Jason asked me to 3D print a model of the spike protein for him which he displayed when interviewed on national FOX News with Bill Hemmer.
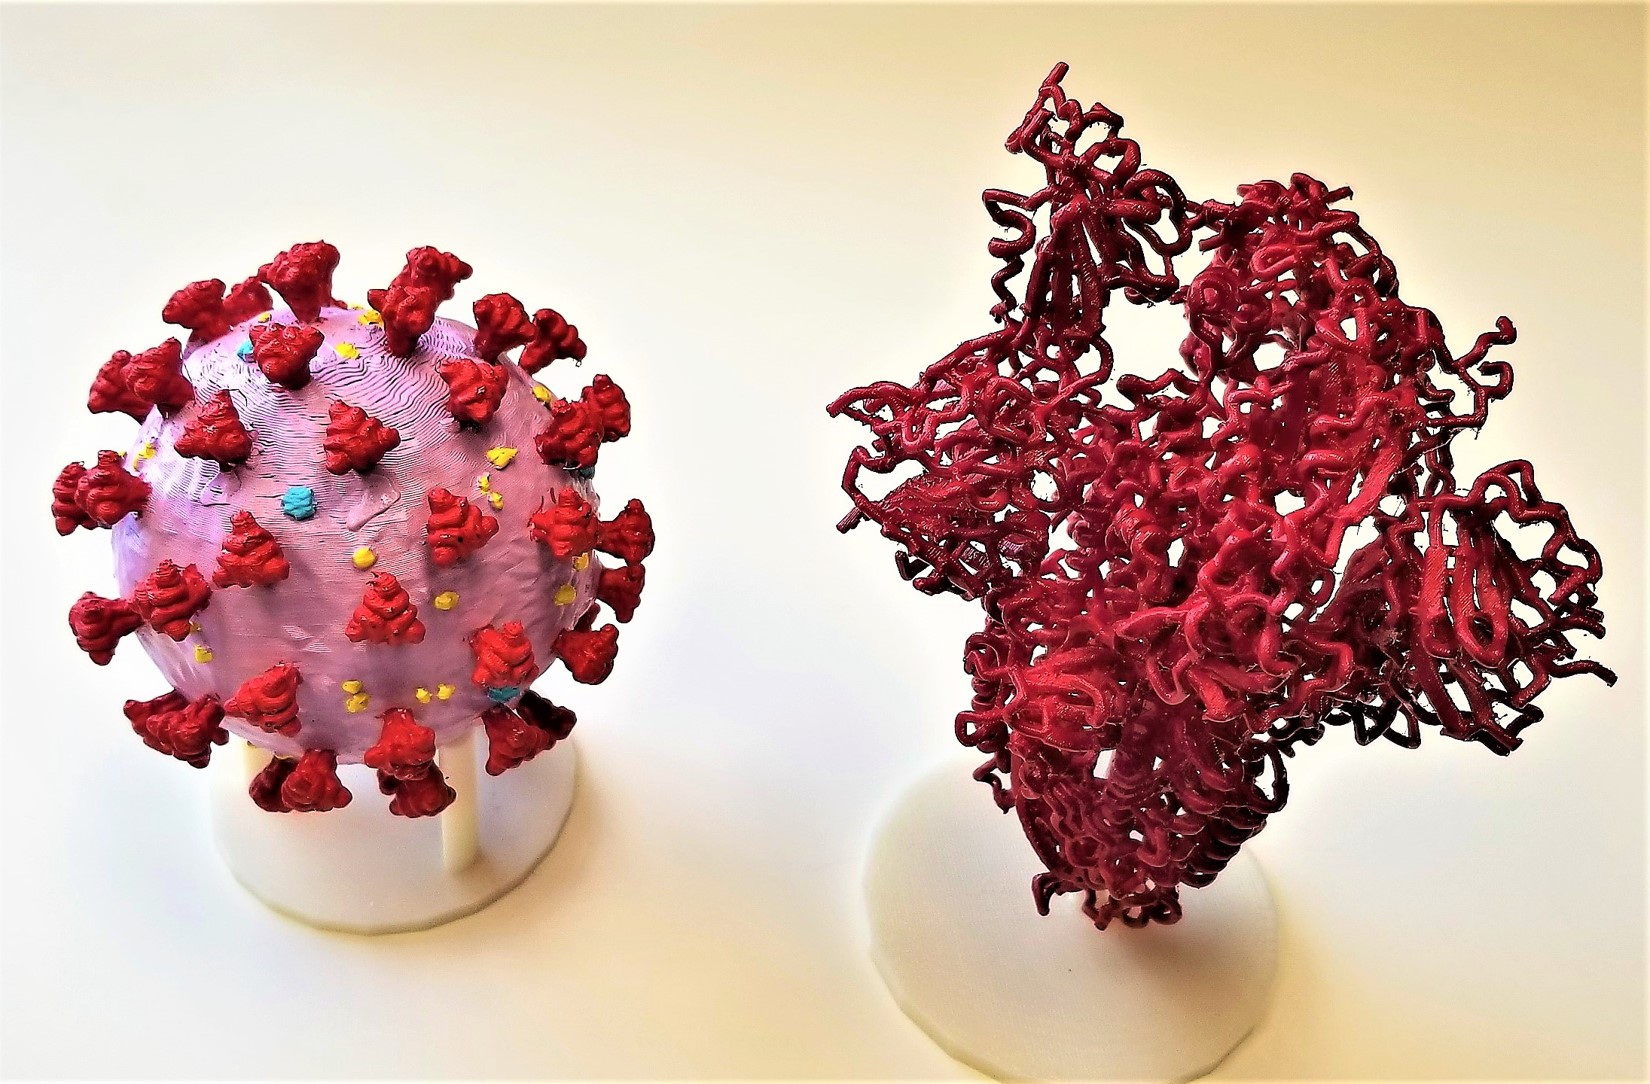
3D printed models of the coronavirus and its spike protein.
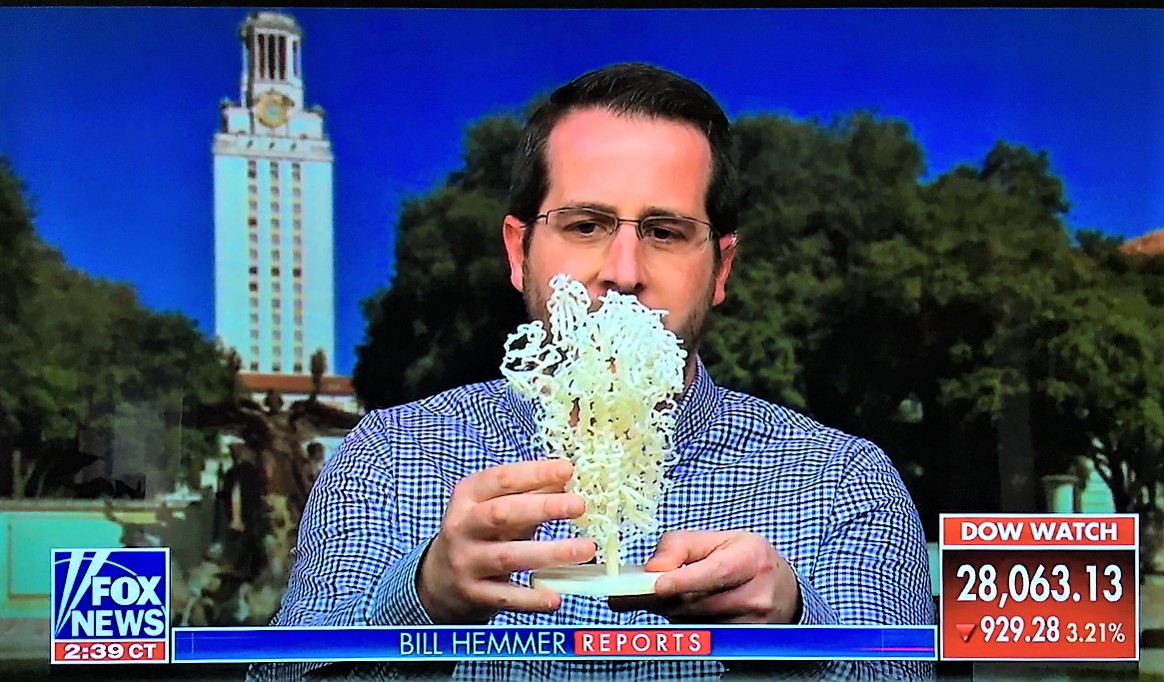
Jason McLellan holding a 3D model of the spike protein during an interview with Bill Hemmer on national FOX News – Feb. 24, 2020.
At record (Warp) speeds (<1 year) several companies have vaccines that have proven highly effective in Phase III clinical trials against the coronavirus. Assuming FDA approval soon of several of these COVD-19 vaccines, tens of millions of doses of vaccine are expected to be available before the end of the year 2020 and billions more doses available in 2021. Hopefully this will end this pandemic that has taken the lives of so many and has been responsible for untold economic hardship for so many others.
Each of our life journeys is unique, but our lives are impacted by those that came before us and by those that we encounter along the way. We all have opportunities to say or do something that can help transform someone’s life for the better, and thus make the world in which we live also a better place. Mostly, we will not know if that minute or two of time we took to listen, or to encourage someone, will be one of those defining moments in the life of that individual, but I believe there are more such opportunities than we realize. I am a lucky and fortunate person with much to be thankful for – I have a wonderful wife, two great sons, a terrific daughter-in-law and a delightful granddaughter, plus a job that I like at a great University in a great American city. John Lennon noted "Life is what happens when you are busy making other plans." I had no idea where my journey would take me when I was attending that one-room country school house in Iowa, or will take me still, but I definitely have enjoyed and I am grateful for the journey and the people I have met and been fortunate to work with along the way.
Addendum
I have long had an interest in the history of science and more recently family genealogy. In that regard, I have tried to share some of that historical perspective with my students and others. I have included three examples of this to share in this Addendum.
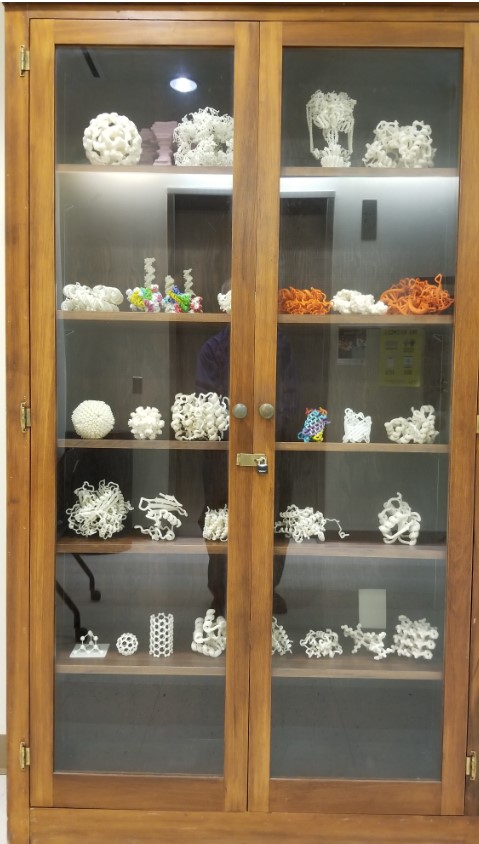
A) Public display of molecular models
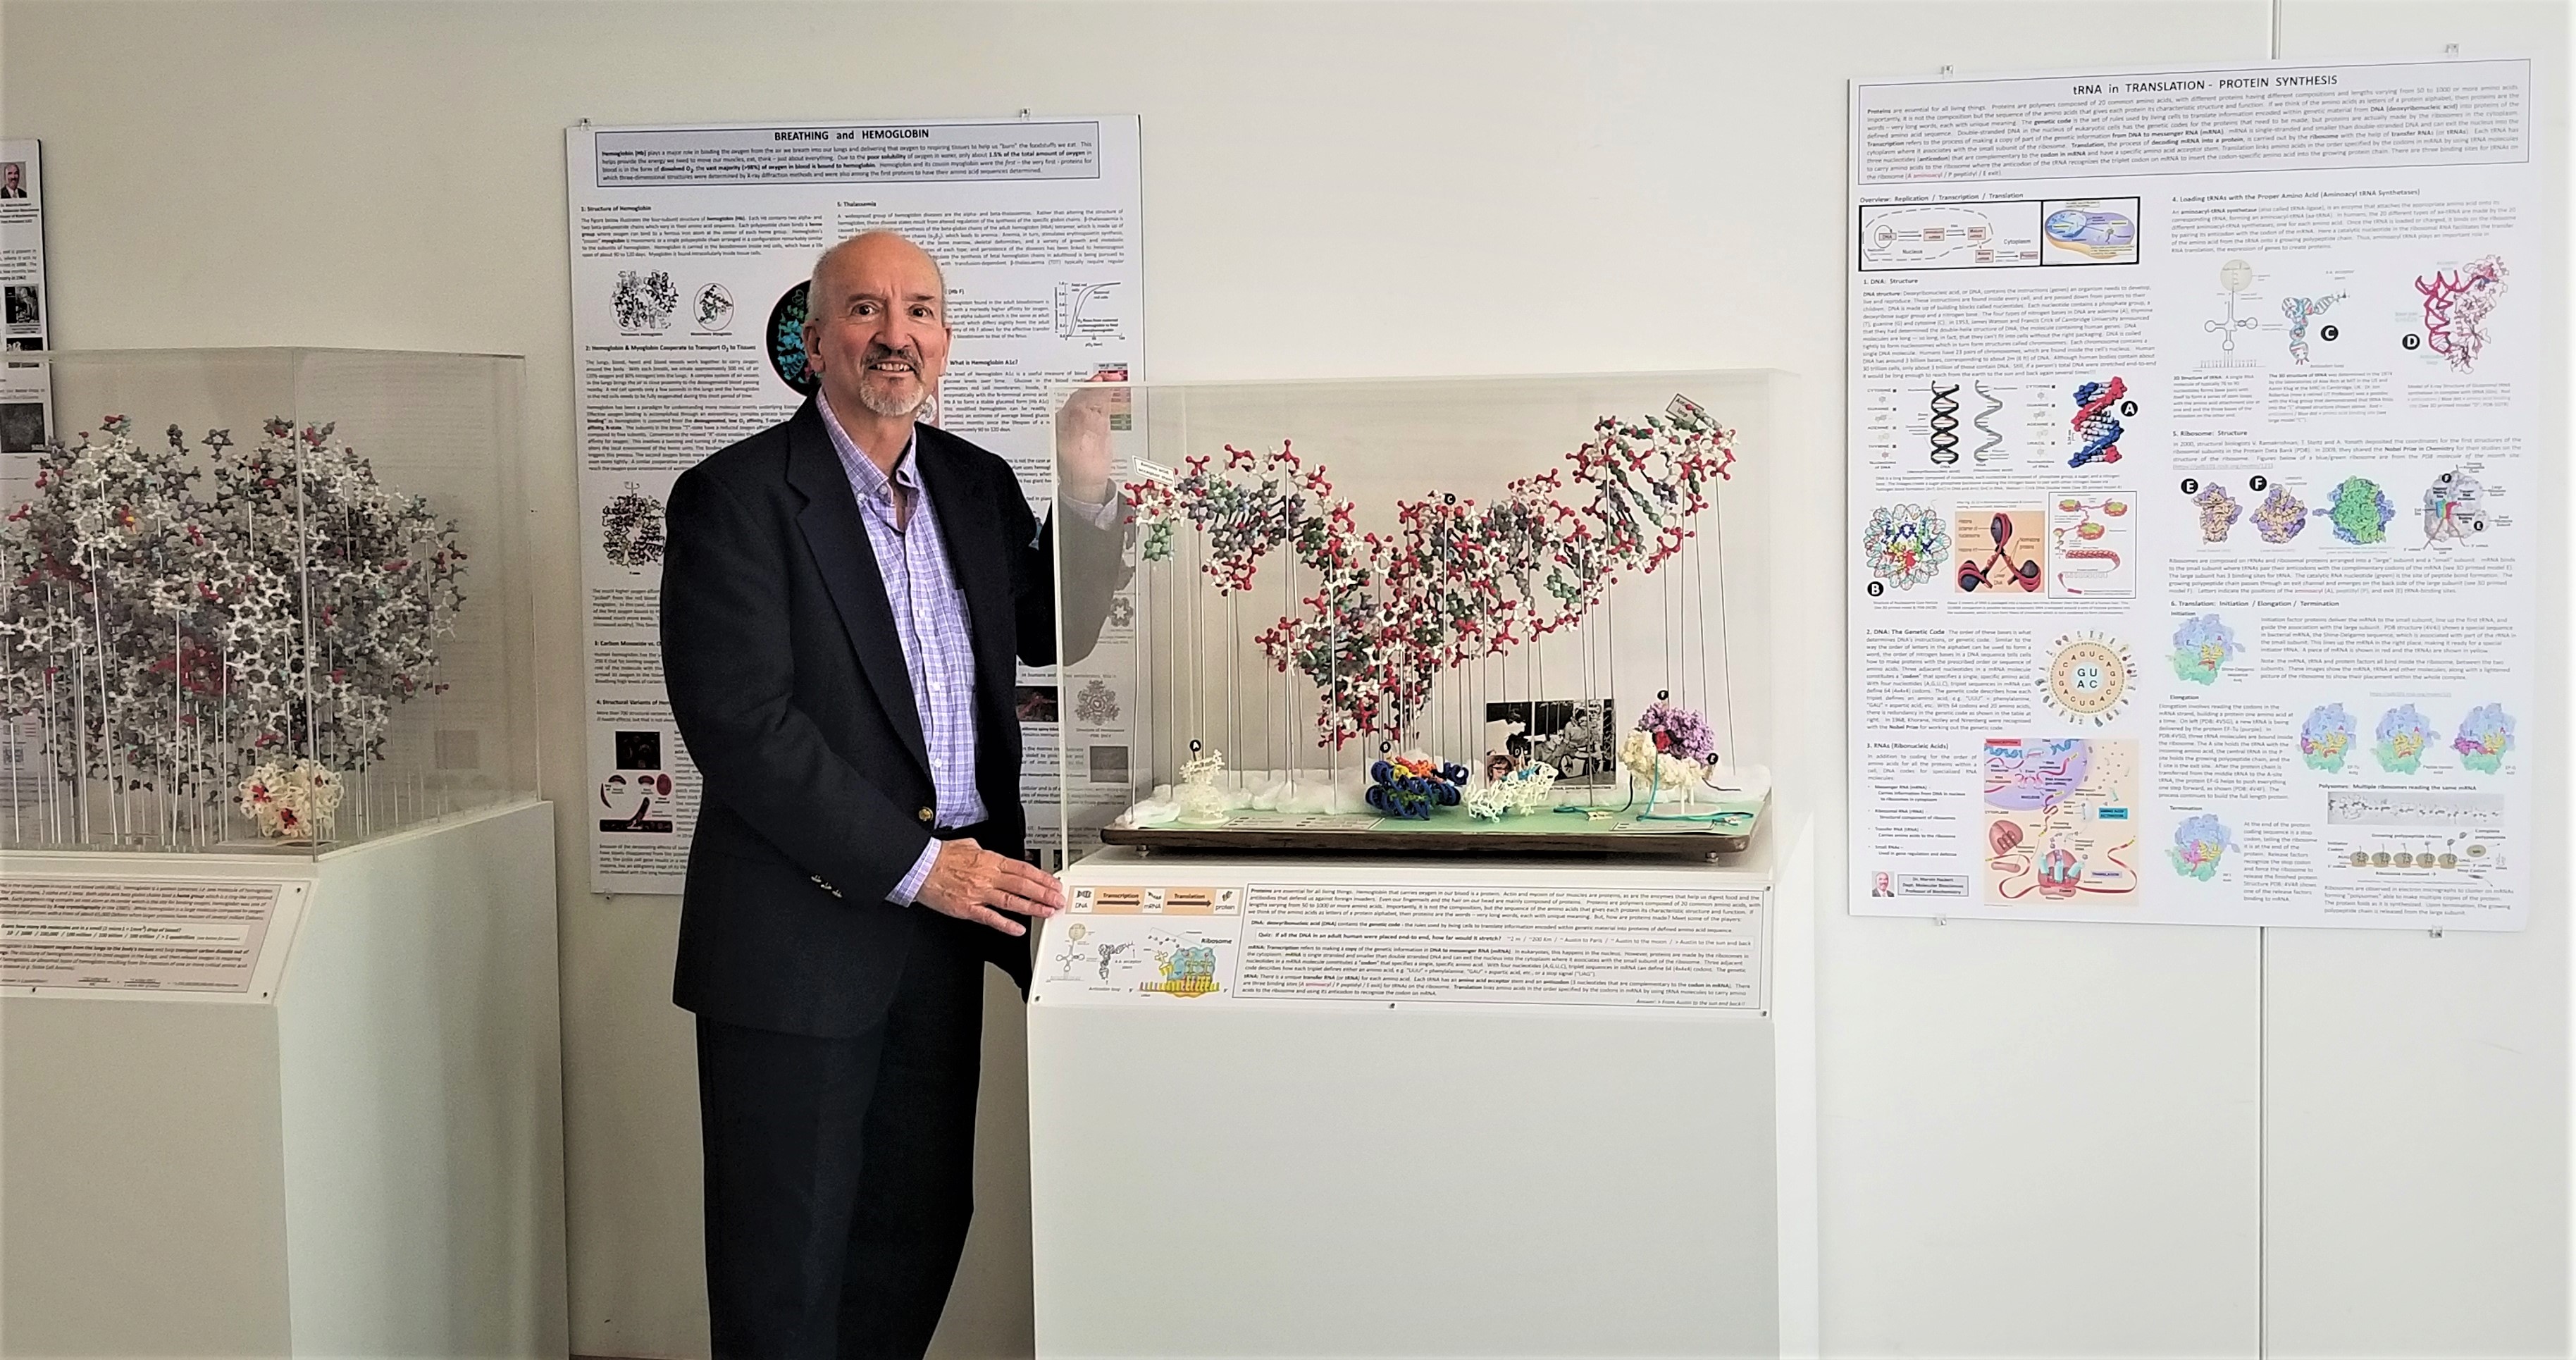
Large display of molecular models with posters.
3D printed models.
When people would walk into my office or lab and see some of the larger molecular models we used to make decades ago, they would find them fascinating. So I decided to take some of the larger molecular models that had been collecting dust for years in my lab and make them available to the public as part of a public display to explain and publicize what structural scientists do! The models are in dust-free in display cases I had built in the carpentry shop and displayed in the main hallway of one of our newer science buildings that is on one of the more popular campus tour routes, so the display is getting lots of public exposure. Each of the larger ball-and-stick models is augmented with smaller 3D printed models that I printed and each display is accompanied by a poster that explains the biochemical importance and function of the molecules displayed. In total, there are 3 such display cases and 4 posters creating a display that is over 20 feet in length. The 1st poster is on the History of X-ray Crystallography, then comes a model of tetrameric hemoglobin along with a poster on structure and function of respiratory proteins. Next is a large model of t-RNA along with smaller 3-D printed models of DNA; a nucleosome core particle; a t-RNA synthetase complex; and a model of the small ribosomal subunit with three bound t-RNAs and the large ribosomal subunit with growing polypeptide exiting the peptide channel! The accompanying poster covers an overview of DNA, RNA, the genetic code, the structure of the ribosome, and the process of protein biosynthesis. The last model is an enzyme - pyruvoyl-dependent histidine decarboxylase. The model emphasizes the relative sizes of enzymes and their substrates, and poster focuses more generally on the properties of enzymes and coenzymes, the roles of vitamins and the contributions of biochemists at UT Austin in the discovery of many vitamins.
For more examples of 3D printing – see demo here.
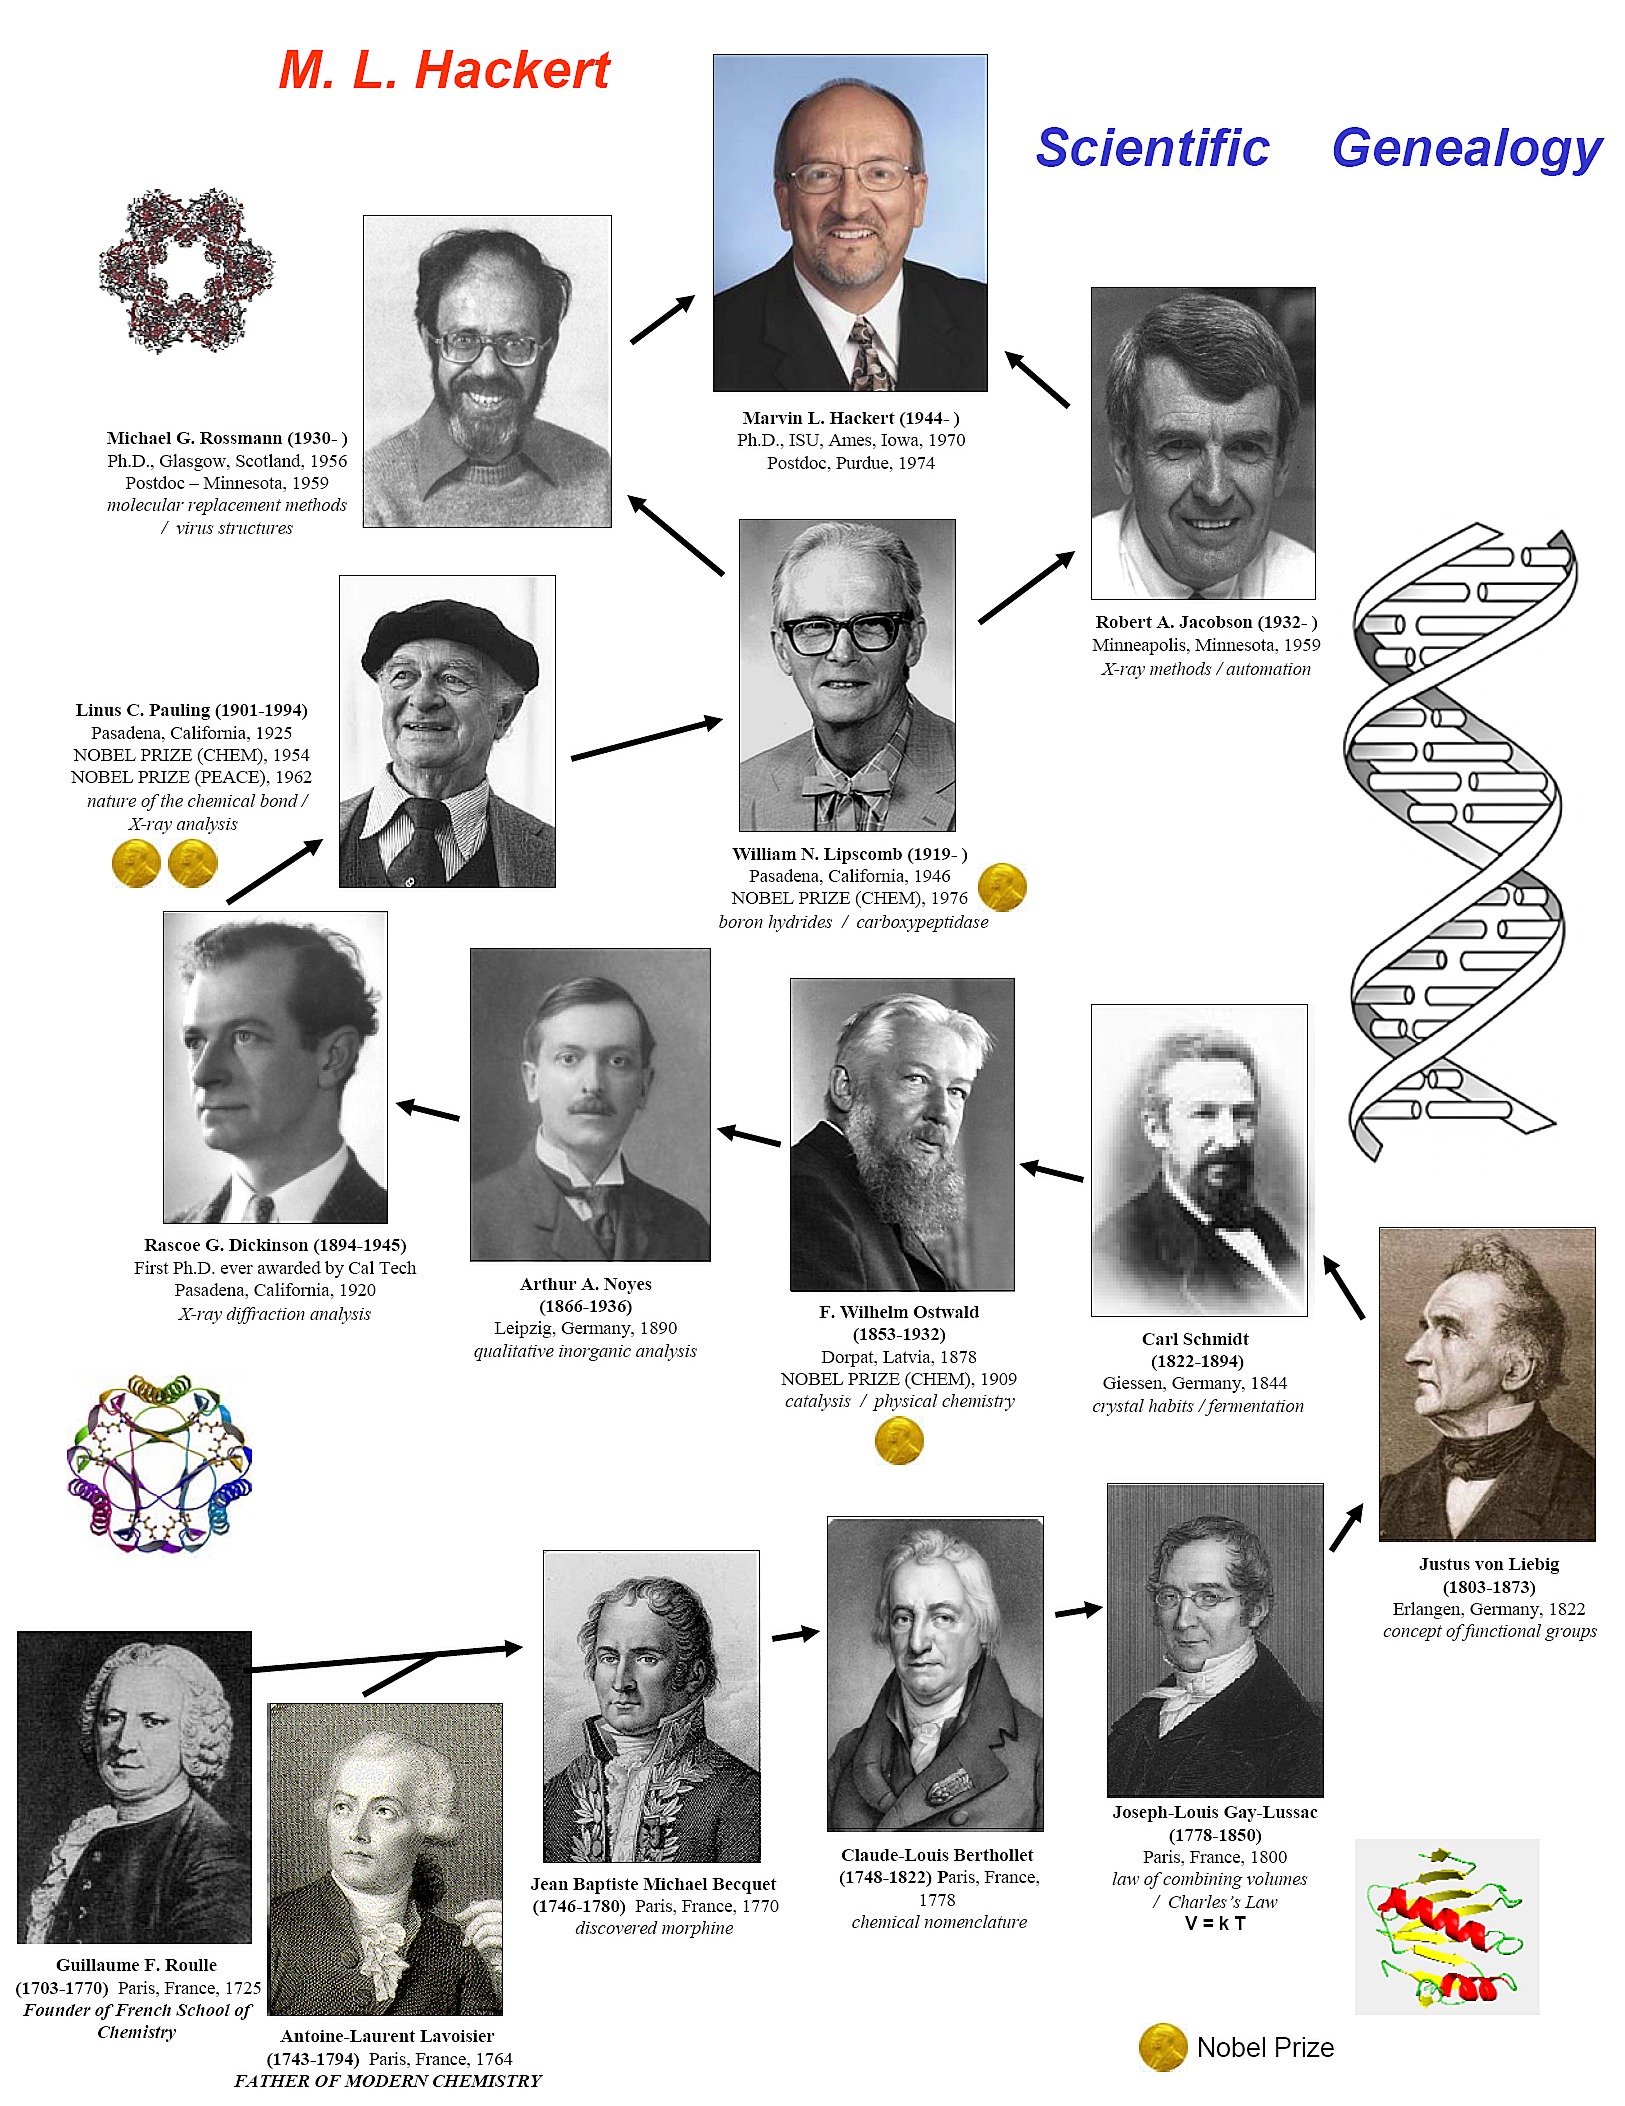
B) Scientific Genealogy
C) International Union of Crystallography (IUCr)
i) First Congress and General Assembly of the IUCr
Cambridge, Massachusetts - - July 28 – August 3, 1948
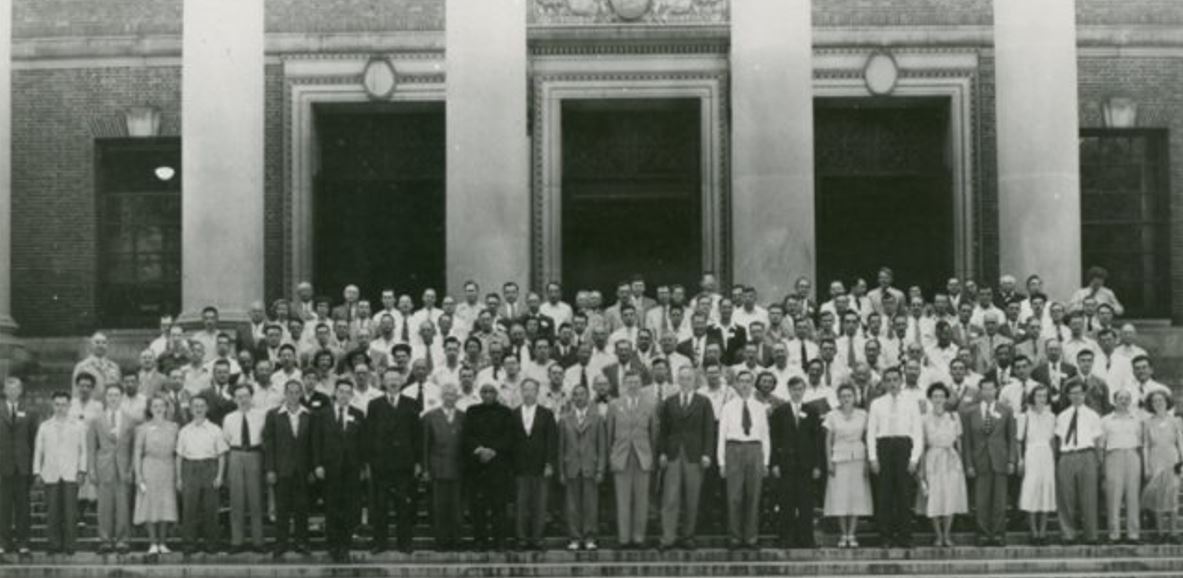
First General Assembly and International Congress Acta Cryst. (1948). 1, 340-343.
ii) Past Presidents of the IUCr (1948 – 2017)
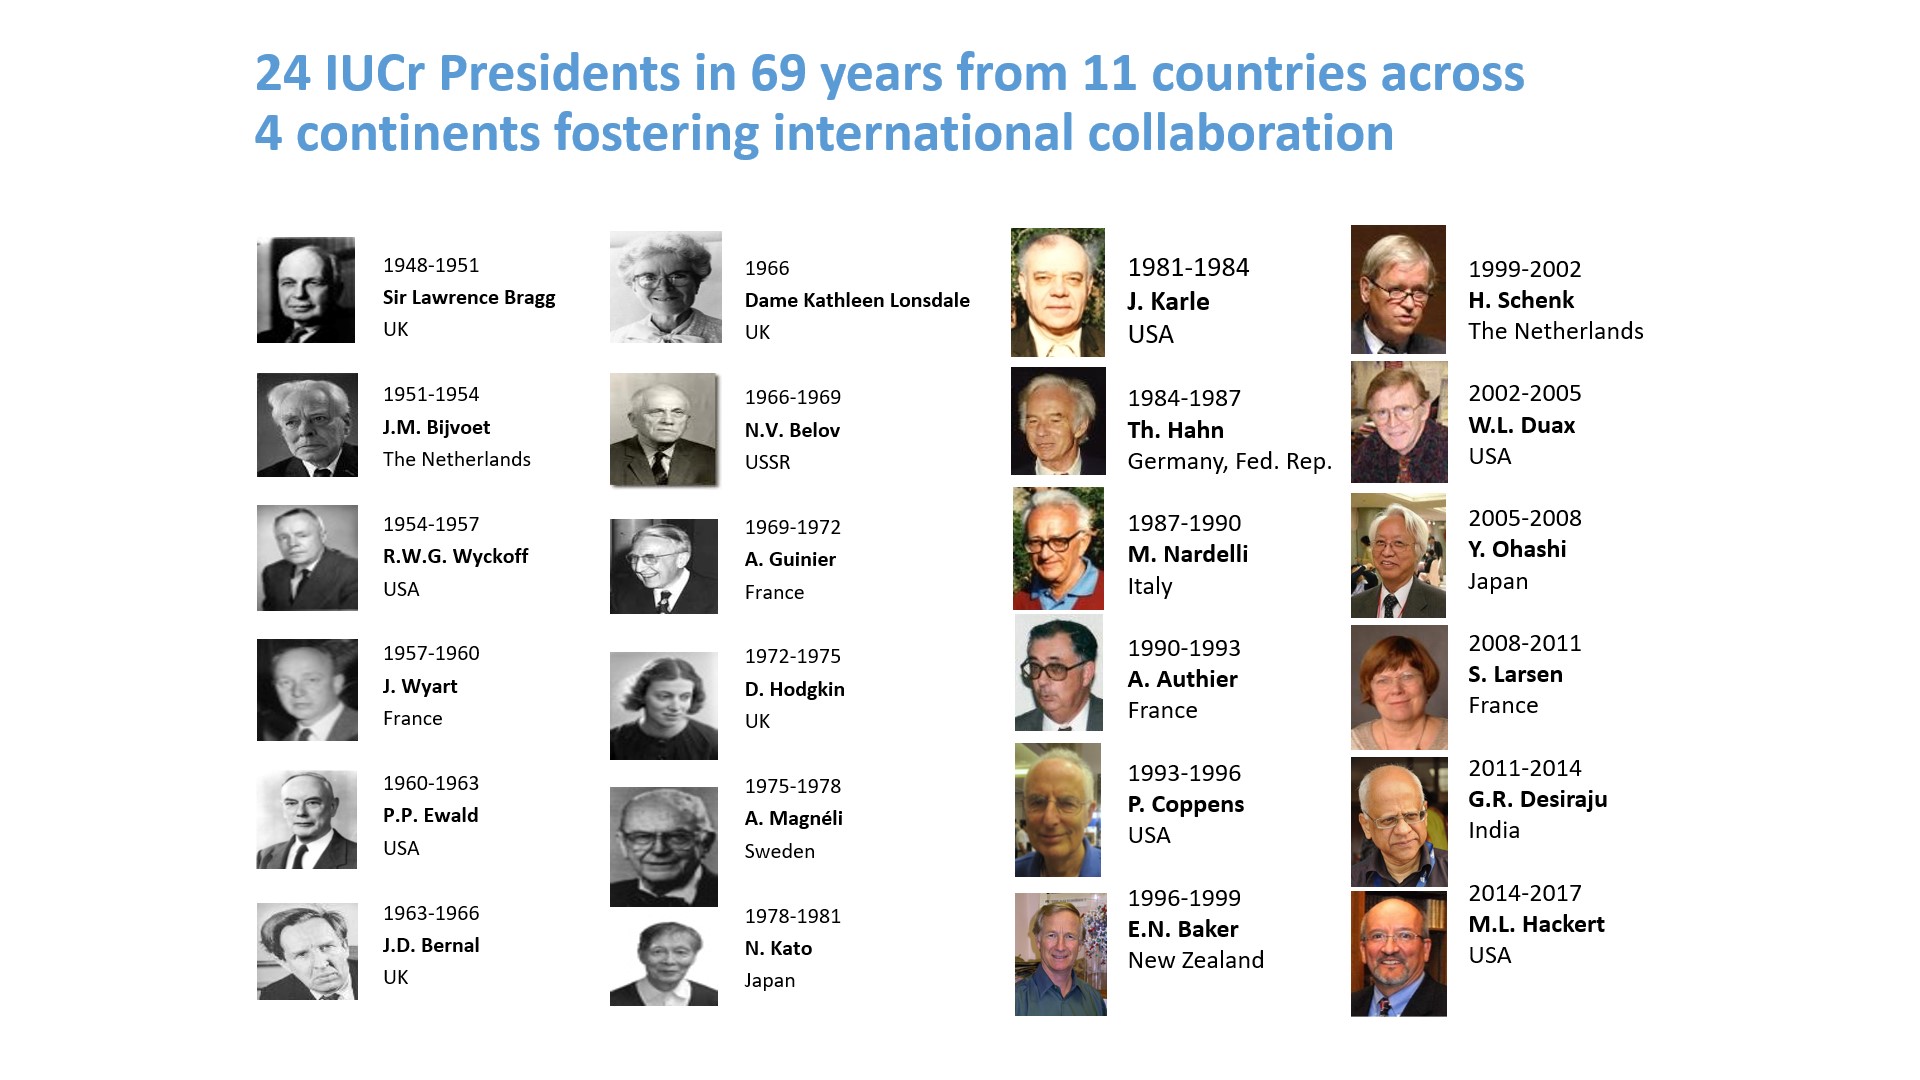 24 IUCr Presidents in 69 years from 11 countries across 4 continents. 24 IUCr Presidents in 69 years from 11 countries across 4 continents.
- Submitted December, 2020
|