- History Home
- People, Leadership & Service
- A Legacy of Excellence
- History & Impact
- Meetings Through the Years
- Resources
Biography - Robert Von Dreele
Biography | Publications | Curriculum Vitae | Videos | Slides | Articles | Obituary
2019 Trueblood Award
I am honored to be this year’s co-recipient of the Trueblood Award and particularly want to thank those who in a timely way helped me on my way to here. Tony Cheetham for his suggestion about doing a neutron powder diffraction experiment, Allen Larson for his mentorship in crystallographic computing while creating GSAS, Brian for his collaboration on GSAS-II, Peter Stephens for his willingness to entertain a crazy experiment involving protein powders on his beam line, Hans Bunge for his guidance in doing texture analysis, Bob Blessing and Jim Jorgensen for their encouragement. Finally, I must thank the US DOE for its support without which the work would not have been possible.
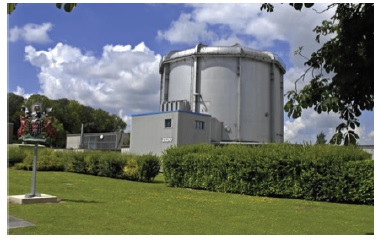
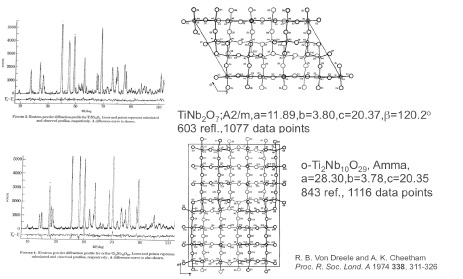
PLUTO Reactor AERE Harwell. In late 1972 while I was a postdoc in J.S. Anderson’s lab at Oxford, Tony Cheetham stopped by to ask if I was interested in doing a neutron powder diffraction experiment. He had a copy of a new computer program from Alan Hewat written by some Dutchman (Hugo Rietveld). The PLUTO reactor was close by at Harwell and had a powder diffractometer that might suit. So we made two samples of titanium-niobium oxides and did the diffraction experiments – each run was 3 days. The object was to determine the metal site distributions in these “block” structures that were all the rage at the time. One could see the blocks in electron microscope images. Hugo’s program was a typical crystallographic one with decks of cards as the code and input. The program punched a new set of cards to be used for the next iteration (it was a least squares refinement process) along with a line printer output for us to peruse – including a line printer rendition of the 600-700 point powder pattern – to decide what to try next.
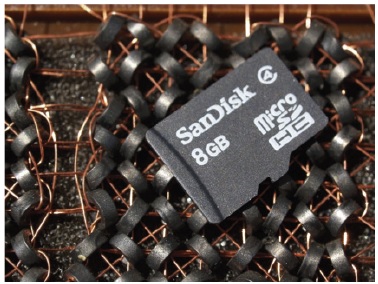
Magnetic core memory 8x8 bit memory block - 8 bytes (Cƒ: modern 8Gb chip). The manual was typical of that era; details of each line of input controls and data with a listing of the code at the back. The biggest change during my career has been in computing. The machine at Oxford was a huge main frame machine with magnetic core memory; the scale in memory size shown here covers 9 orders of magnitude in almost 5 decades – that’s Moore’s Law.
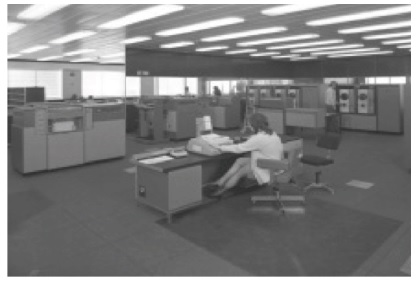
Oxford ICL1906a - Banbury Rd, Oxford. The titanium-niobium oxides Tony & I worked on were too large for Hugo’s program as written. It couldn’t handle more than 300 reflections within the Oxford computer and these problems were much larger. So I had to modify the code to use a window of reflections that moved across the pattern as it was processed. This allowed much larger problems to be addressed; these two were some of the largest structures refined from powder data for many years after until folks began working on e.g. zeolites.
Some of the largest structures done by powder diffraction for many years. When I got back to Arizona State University, I gave a copy of this code to Ray Young (Georgia Tech). It included my attempt at fitting laboratory X-ray powder data (I had used data from an old GE goniometer set up in the Oxford Geology Department) which didn’t work because the peaks weren’t Gaussian. Ray & his students found a number of functions that fit the peaks – most especially the pseudo-Voigt; a linear combination of Gaussian & Lorentzian profiles still in use today. This effort resulted in the DBW & DBWS programs they adopted for the IBM PC computers. With that in hand Ray, Tony & myself went to several places around the world to educate students in this new method of structure analysis from powder data. We called it the Rietveld Refinement Road Show and went to Poland, Russia, Brazil & Argentina to spread the word. The DBWS code (NB: open source) became the core of several other packages including fullprof and LPHM (there may be others). Later I used my version (before DBWS) to create a working code for Rietveld refinement using neutron time-of-flight data. This became the basis of the tofpref/tofls package used for many years at IPNS (Argonne Natl. Lab.)
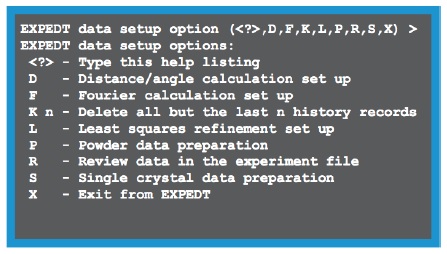
Menu-driven editor - EXPEDT - state of the art in the 1980's. In the early 80’s I was spending summers in Los Alamos (Phoenix is too hot in the summer!) as a part time contractor. The group leader, Richard Silver, asked Allen Larson and I to support the data analysis for the single crystal and powder diffractometer instruments at the WNR spallation neutron source. We decided to combine our efforts and do one code that did both tasks – after all the math was the same. Thus the Generalized Structure Analysis System – GSAS – was born. It had to deal with multiple data sets because that’s what neutron TOF data was. Powders were also frequently multiphase mixtures so that added to the complexity. We immediately recognized that an editor with error checking would be needed to give the user any hope of successfully setting up the control file; so we created EXPEDT – a state of the art user interface for the 1980’s computing. Its type ahead feature was especially useful. Later (early 1990’s) Brian Toby created EXPGUI, a more modern user interface that gave the novice a less imposing way into GSAS.
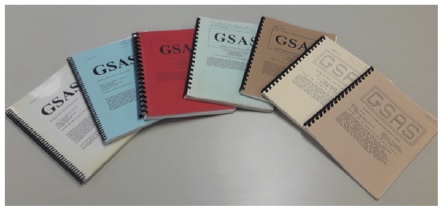
GSAS Manual (seven editions; 1985-2004). I then moved GSAS from its original computer platform (DEC VAX machines) to Silicon Graphics IRIX and then to Microsoft MS-DOS & Windows. Many additions & changes to the code were made as the scope expanded and improvements were made to the powder profile functions. This is reflected in the change in number of pages for the manual (150 in the 1986 edition to 250+ in the 2004 one). However, it clearly had limits especially in the number of data sets that could be processed and the lack of structure solution tools.
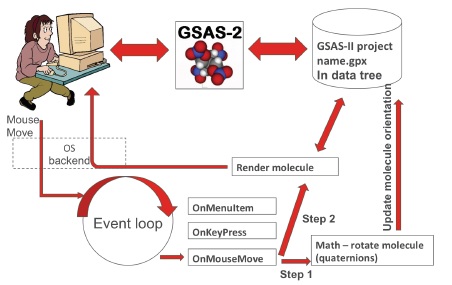
21st century crystallographic software. Clearly something new was needed. Today’s computer users are not tuned into the old paradigm of manuals, card oriented control files & batch programs. Computer speed had made the need for that almost obsolete. Thus the new code is based on an “event loop system”.
Event loop systems - what you see. The way this works is that the user, say, moves the mouse (with a button down) wanting to rotate a drawing of a molecule shown on the screen. This creates an event (mouse move/button down) that is seen by a routine specifically written to handle it. The routine then calls the various utility routines (some with math) to convert the mouse move (from a previous saved point) to a vector which is used to rotate the object (via a quaternion), update the data and finally send new drawing instructions to the graphics hardware so the user sees it to move as desired.
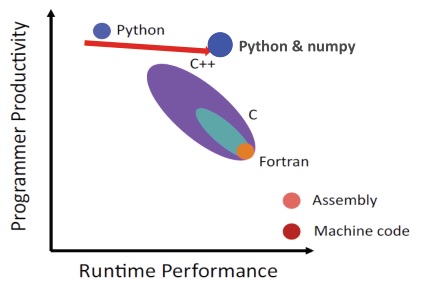
Why python? Based on: RW Groose-Kunstleve, TC Terwilliger, NK Sauter & PD Adams, Source Code for Biology and Medicine 2012, 7:5. A good language for doing this is python because it and the available packages for it cover all that is needed to quickly and easily create a modern GUI event-based package. The inclusion of numpy for numerical array calculations gives properly written python speed that is comparable with code in other languages along with easily integrated graphics for data plots and crystal structure drawings.
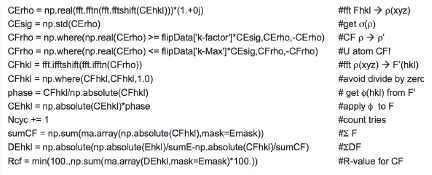
Code snippet - charge flipping all inside a "while" loop For example, this is a bit of code for charge flipping in python. The entire algorithm is in 8 easily understood lines; there are 4 extra ones for housekeeping (on the fly calculation of residuals). I don’t show the code here but an OMIT map is easily done in python and it’s inclusion in GSAS-II means it could be used for any structure beyond its original intent for protein rebuilding.
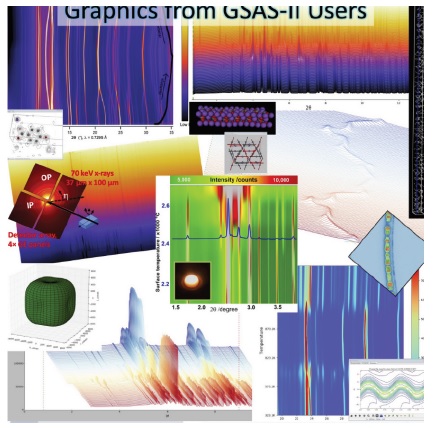
Many of these pictures were contributed to us by users. We were amazed at how many of them featured hundreds of powder patterns showing things like phase transitions or chemical reactions all being analyzed by GSAS-II.
Top photo of Robert Von Dreele in 2019 by R.H. Bromund |